Fig. 8.
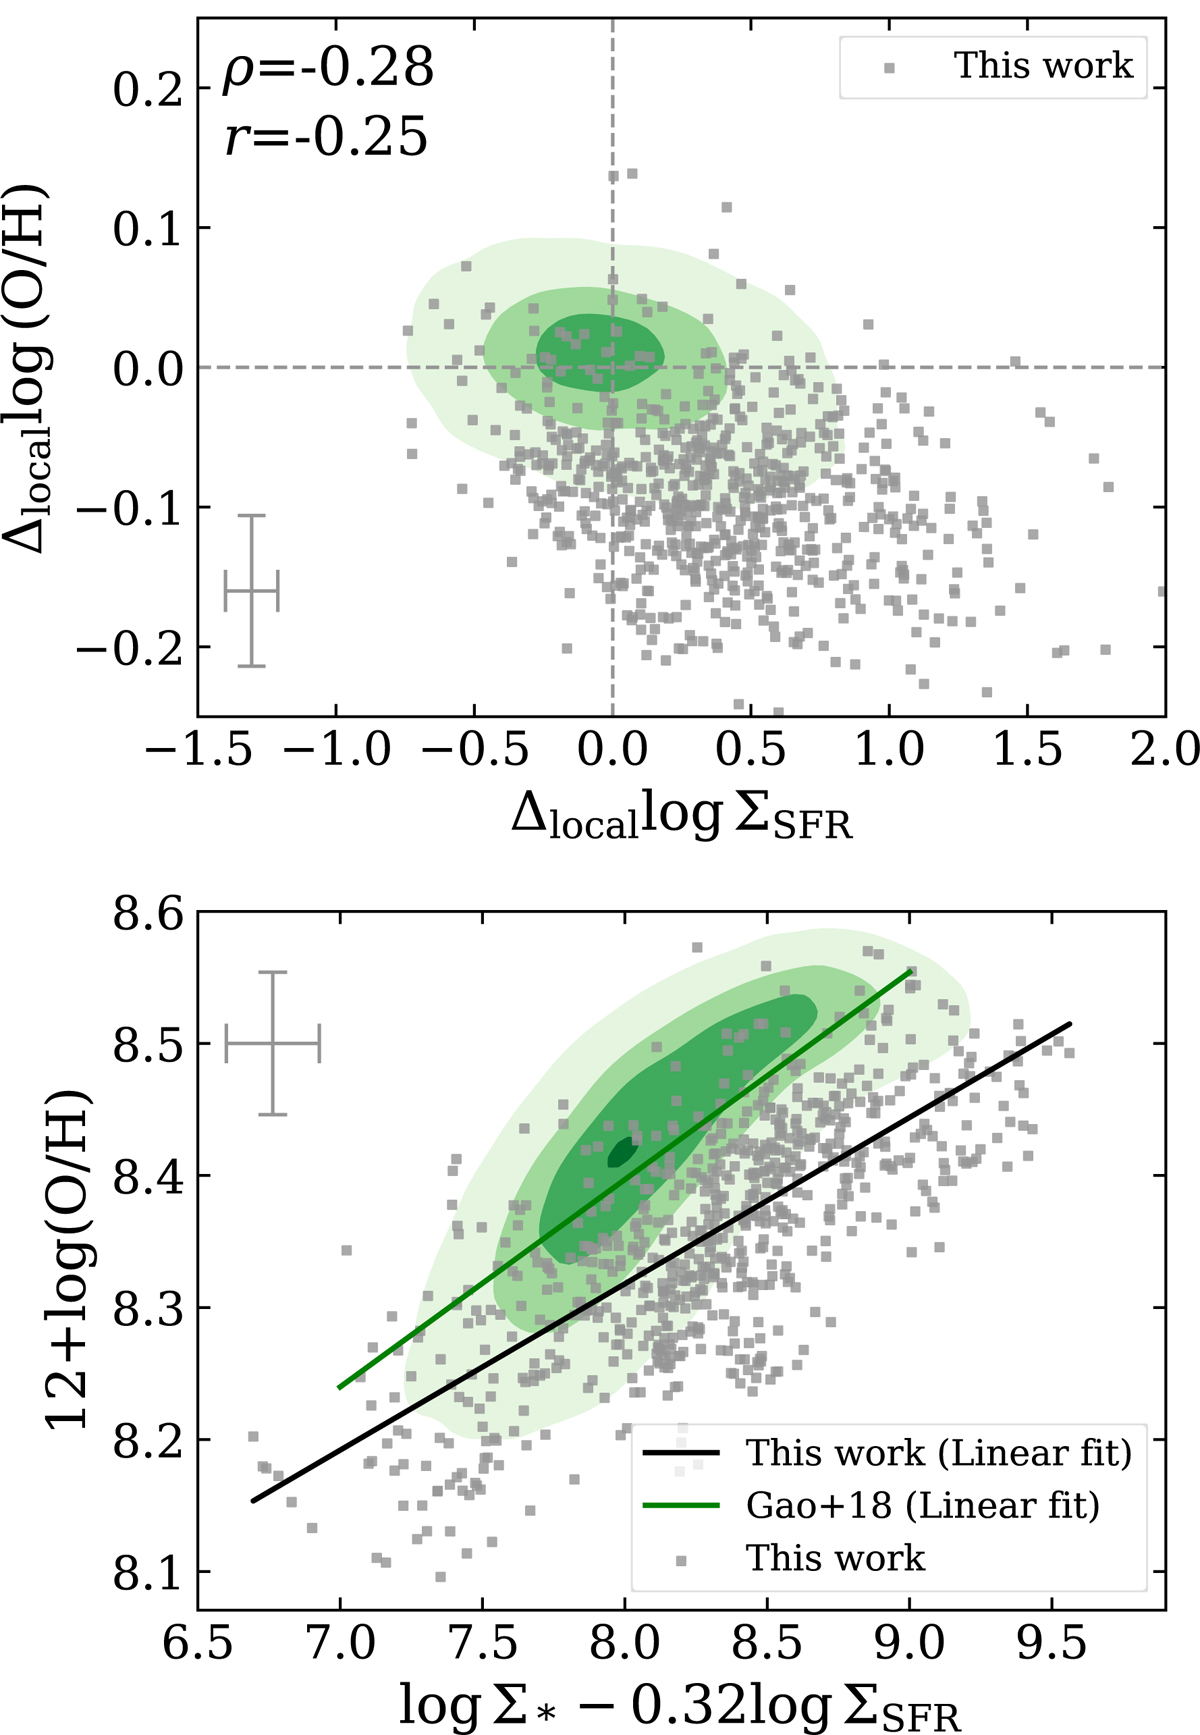
Download original image
Residuals of the rMZR and residuals of rSFMS fitted by Gao et al. (2018b) (top panel). rFMR diagram assuming α = 0.32 (bottom panel). The two lines with different colors represent the results of linear fitting of the two rFMRs. The gray crosses represent our Voronoi bins and their uncertainties, and the contour filled with green represents the sample of Gao et al. (2018b) in each panel.
Current usage metrics show cumulative count of Article Views (full-text article views including HTML views, PDF and ePub downloads, according to the available data) and Abstracts Views on Vision4Press platform.
Data correspond to usage on the plateform after 2015. The current usage metrics is available 48-96 hours after online publication and is updated daily on week days.
Initial download of the metrics may take a while.