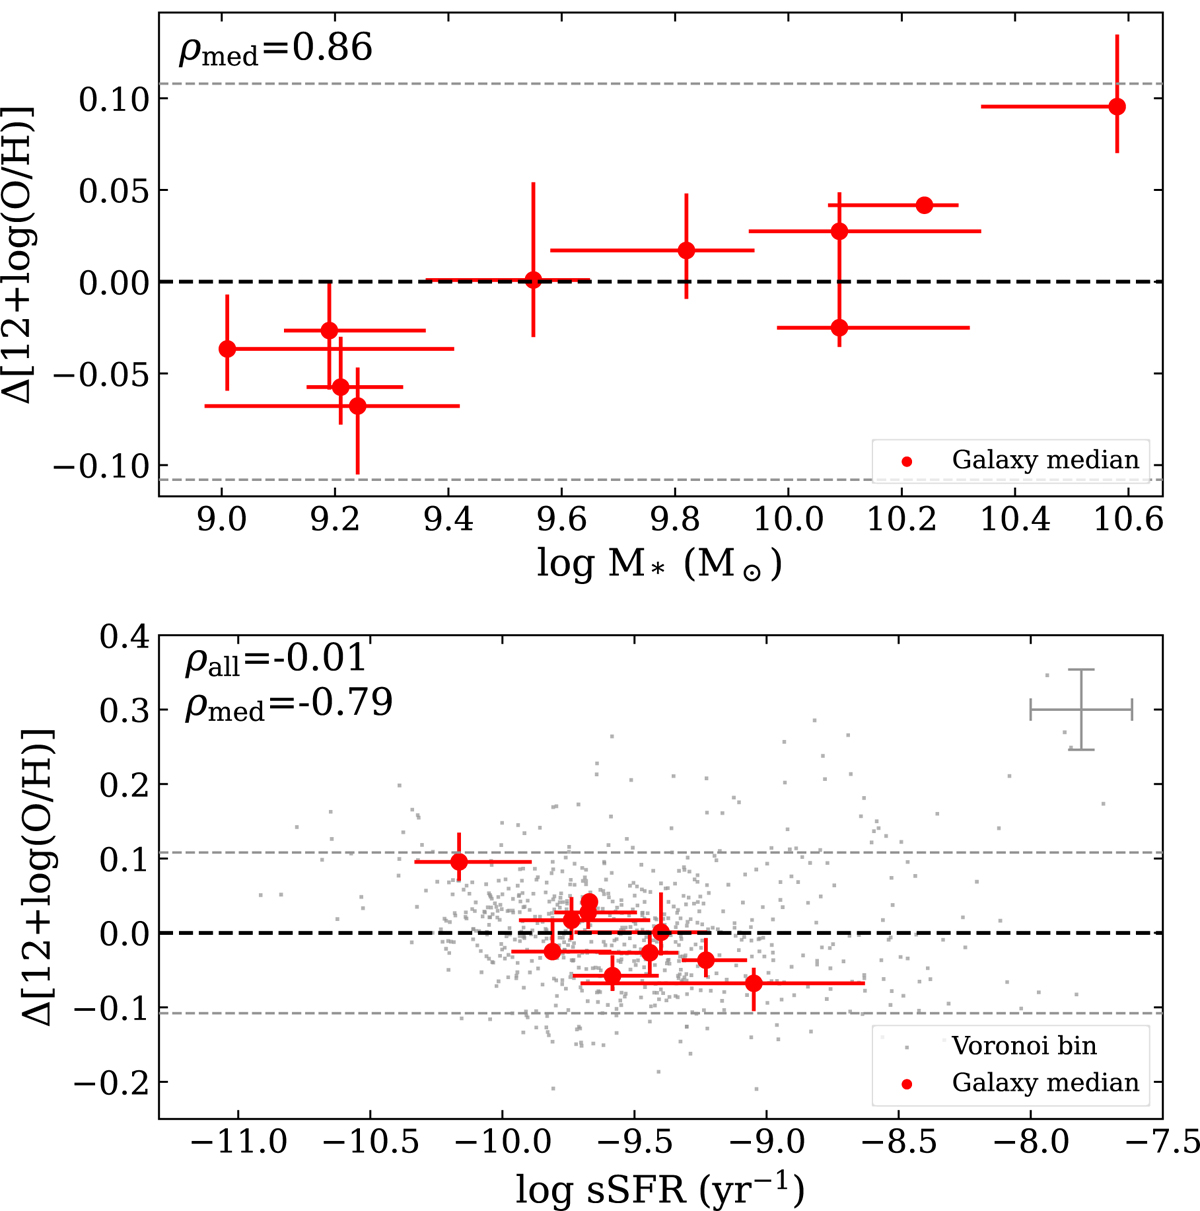
Fig. 6.
Download original image
Relation between Δ[12+log(O/H)] and sSFR and M*. Each red dot represents the median value of a galaxy, whose error bar indicates the 32% and 68% quantiles of the distribution of all Voronoi bins of the galaxy. The gray dots in the lower panel represent Voronoi bins, and the error bar in the upper right corner indicates the uncertainty on each axis. The horizontal dashed gray line represents the average value of the uncertainty of our measured metallicity. The upper left corner is the Pearson correlation coefficient.
Current usage metrics show cumulative count of Article Views (full-text article views including HTML views, PDF and ePub downloads, according to the available data) and Abstracts Views on Vision4Press platform.
Data correspond to usage on the plateform after 2015. The current usage metrics is available 48-96 hours after online publication and is updated daily on week days.
Initial download of the metrics may take a while.