Fig. 4.
Download original image
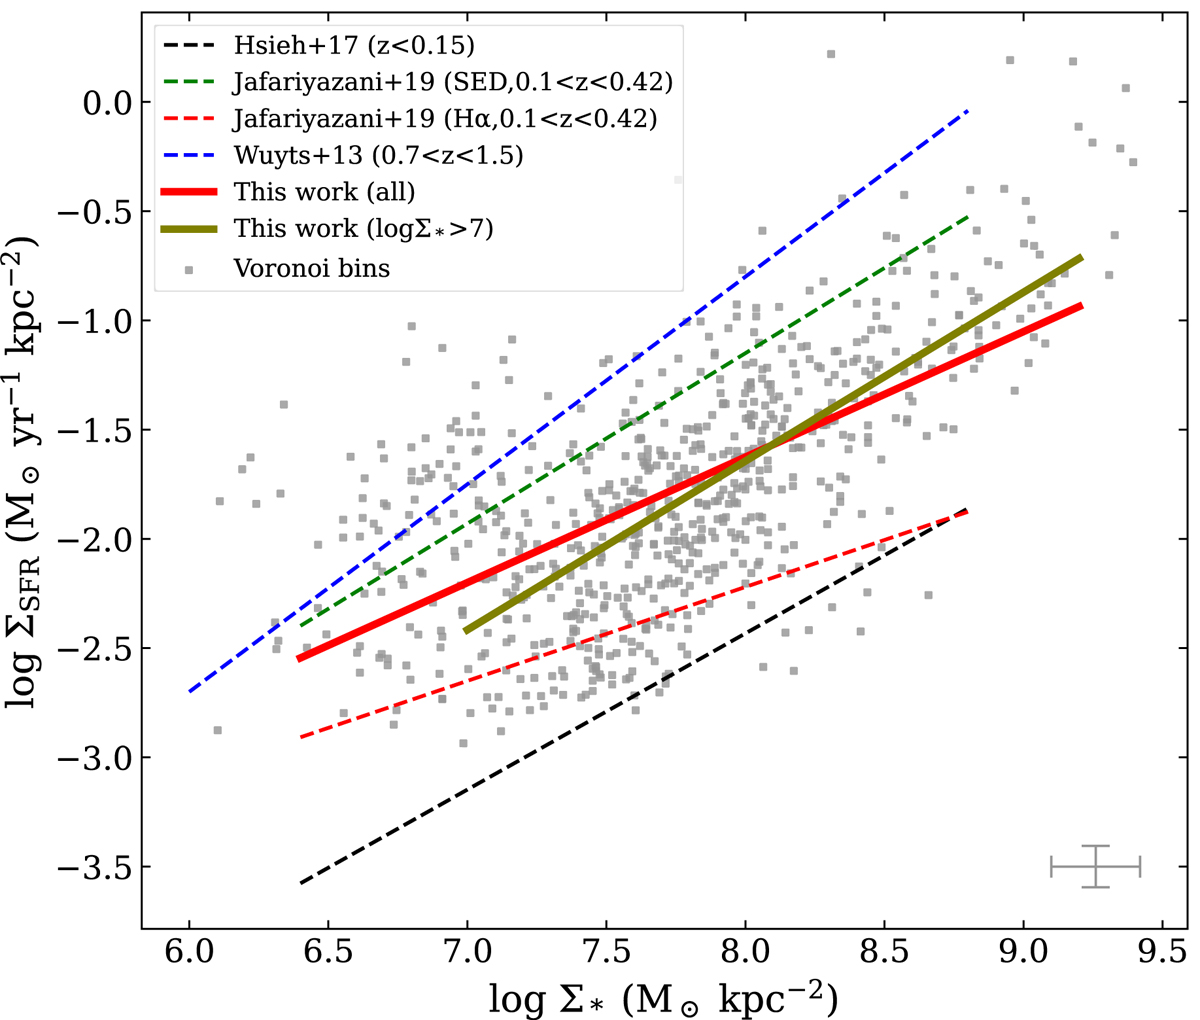
rSFMS of our sample compared with other works. The gray dots represent our Voronoi bins, and the error bar in the lower right corner represents the average value of the uncertainty on each axis. The thick red line represents the linear fit of all Voronoi bins, and the thick green line only fits bins whose logΣ* ≥ 7. The dashed black line comes from Hsieh et al. (2017), the dashed blue line comes from Wuyts et al. (2013), and the dashed red and green lines come from the Hα SFR and from the SED-fitting SFR of Jafariyazani et al. (2019), respectively.
Current usage metrics show cumulative count of Article Views (full-text article views including HTML views, PDF and ePub downloads, according to the available data) and Abstracts Views on Vision4Press platform.
Data correspond to usage on the plateform after 2015. The current usage metrics is available 48-96 hours after online publication and is updated daily on week days.
Initial download of the metrics may take a while.