Free Access
Fig. 3.
Download original image
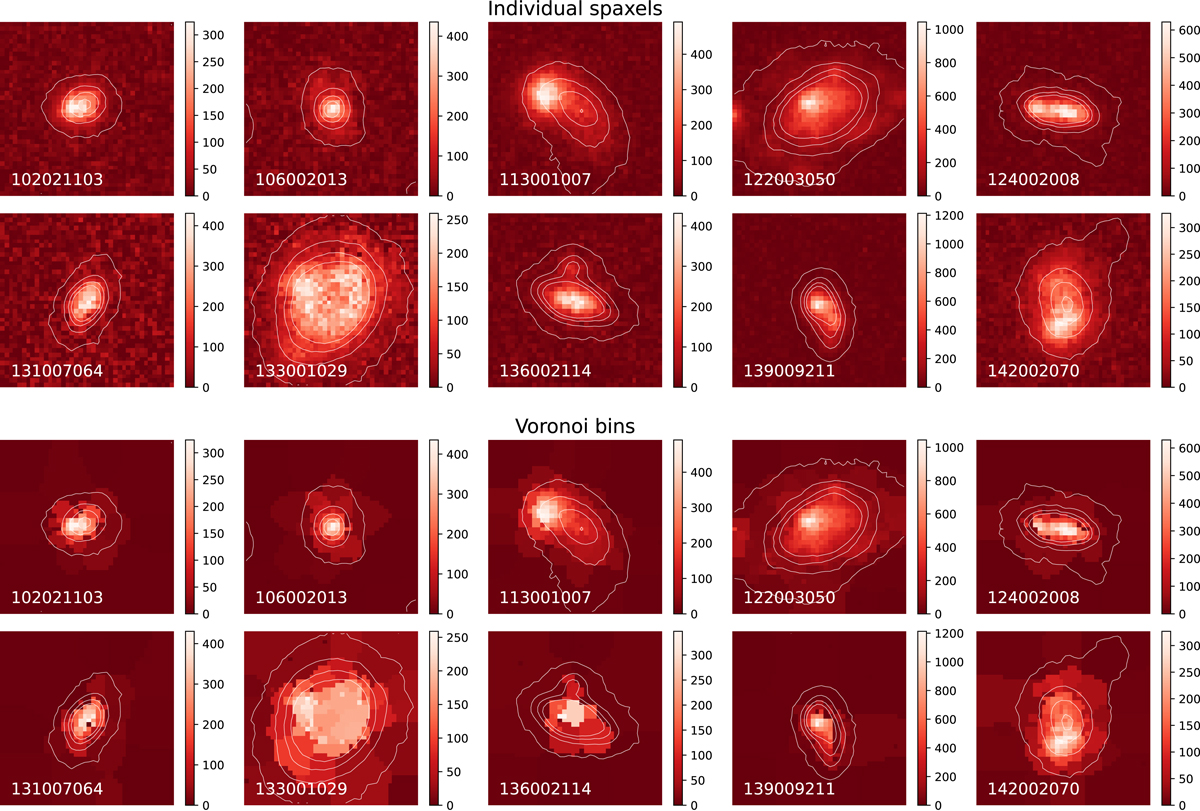
Hα emission maps without dust extinction correction of our ten galaxies. The top two rows are before VorBin, and the bottom two rows are after VorBin. The color bars indicate the flux of Hα in units of 10−20 erg s−1 cm−2. White contours represent the isophotes of their MUSE white-light images.
Current usage metrics show cumulative count of Article Views (full-text article views including HTML views, PDF and ePub downloads, according to the available data) and Abstracts Views on Vision4Press platform.
Data correspond to usage on the plateform after 2015. The current usage metrics is available 48-96 hours after online publication and is updated daily on week days.
Initial download of the metrics may take a while.