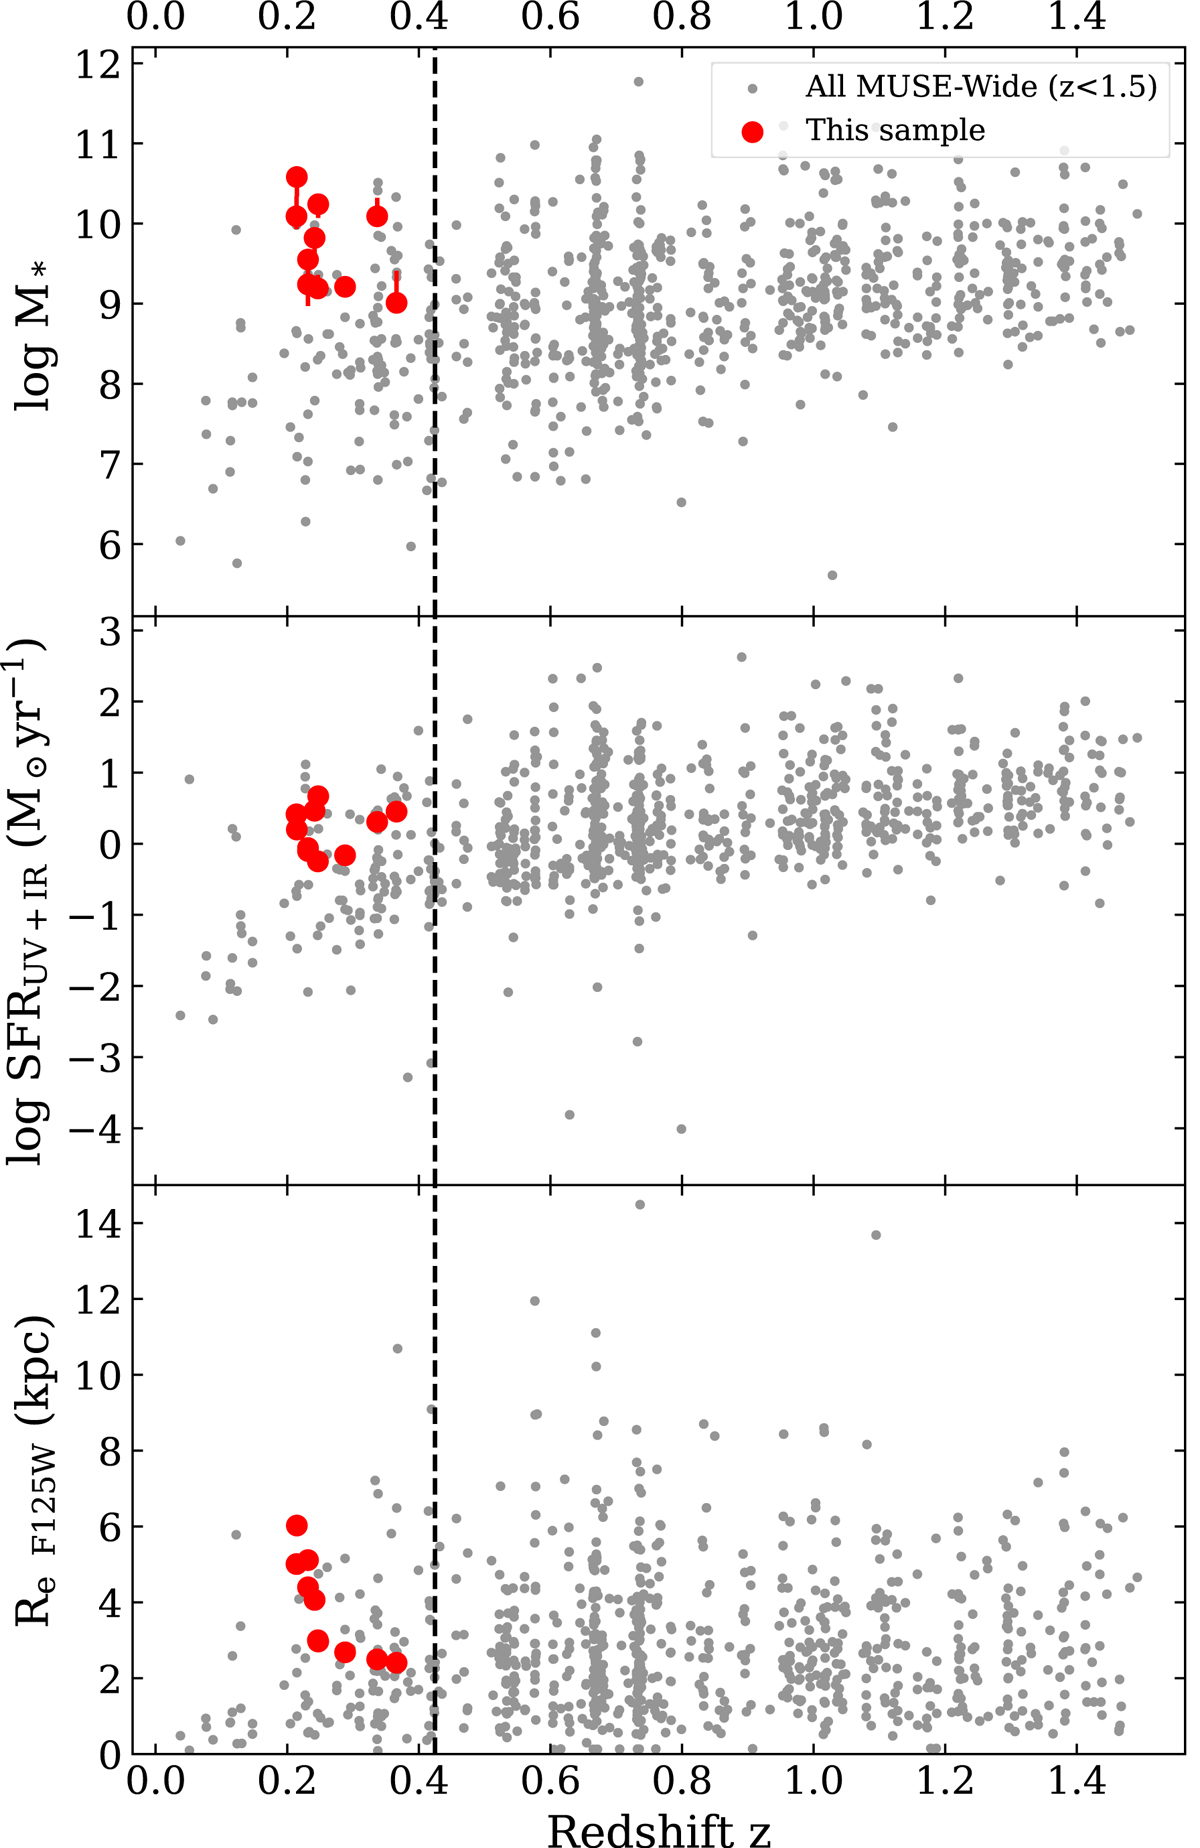
Fig. 2.
Download original image
Stellar mass, SFR, and Re of our galaxies (in red) and all low-redshift MUSE-Wide emission line galaxies (in gray). All values are matched from the 3D-HST GOODS-S photometric catalogs. The dashed black line represents the highest redshift at which the Hα and [N II] emission line can be observed (z ∼ 0.42). This is limited by the wavelength range of MUSE.
Current usage metrics show cumulative count of Article Views (full-text article views including HTML views, PDF and ePub downloads, according to the available data) and Abstracts Views on Vision4Press platform.
Data correspond to usage on the plateform after 2015. The current usage metrics is available 48-96 hours after online publication and is updated daily on week days.
Initial download of the metrics may take a while.