Fig. 8
Download original image
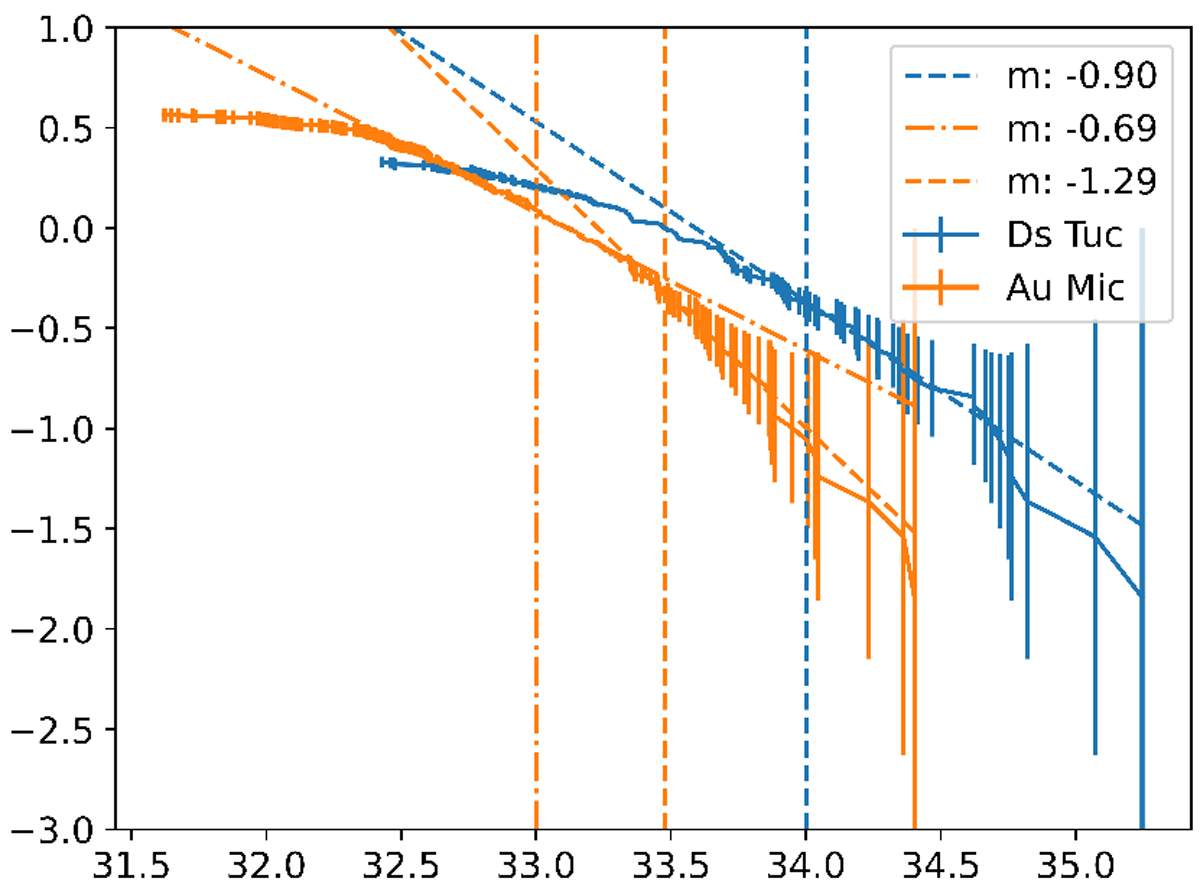
Cumulative log frequency vs. log energy for the total set of observations. Error bars are given by the Poisson noise ![]() . The dashed blue line represents the linear fit for Ds Tuc. The yellow lines show the fits for AU Mic at energies higher than 2 × 1033 erg (dashed line) and for energies higher than 1033 erg (dashed-dotted line). The vertical lines are located at the break energy used for each fit.
. The dashed blue line represents the linear fit for Ds Tuc. The yellow lines show the fits for AU Mic at energies higher than 2 × 1033 erg (dashed line) and for energies higher than 1033 erg (dashed-dotted line). The vertical lines are located at the break energy used for each fit.
Current usage metrics show cumulative count of Article Views (full-text article views including HTML views, PDF and ePub downloads, according to the available data) and Abstracts Views on Vision4Press platform.
Data correspond to usage on the plateform after 2015. The current usage metrics is available 48-96 hours after online publication and is updated daily on week days.
Initial download of the metrics may take a while.