Free Access
Fig. 7
Download original image
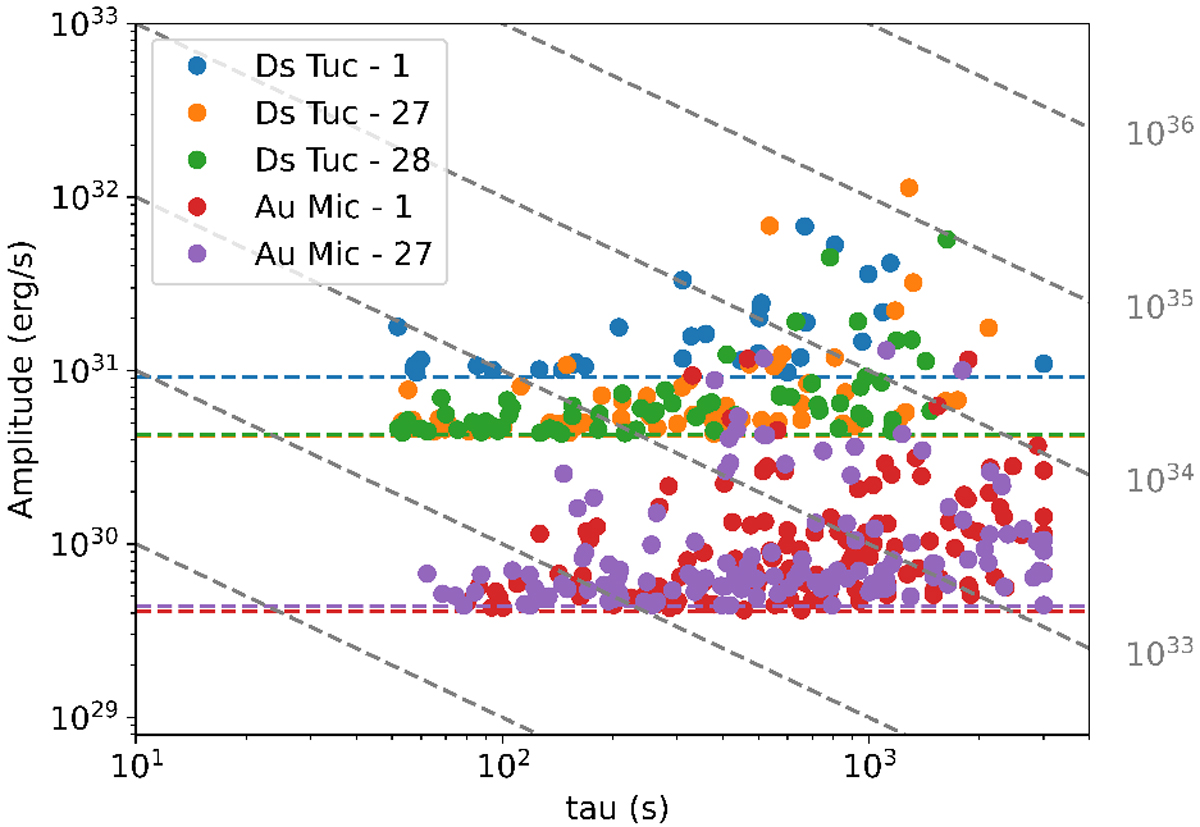
Amplitude vs. decay time for each identified event. The dotted horizontal coloured lines show the 3 a value used to discriminate the events from the noise. The dotted grey oblique lines are the iso-energy lines.
Current usage metrics show cumulative count of Article Views (full-text article views including HTML views, PDF and ePub downloads, according to the available data) and Abstracts Views on Vision4Press platform.
Data correspond to usage on the plateform after 2015. The current usage metrics is available 48-96 hours after online publication and is updated daily on week days.
Initial download of the metrics may take a while.