Fig. 13
Download original image
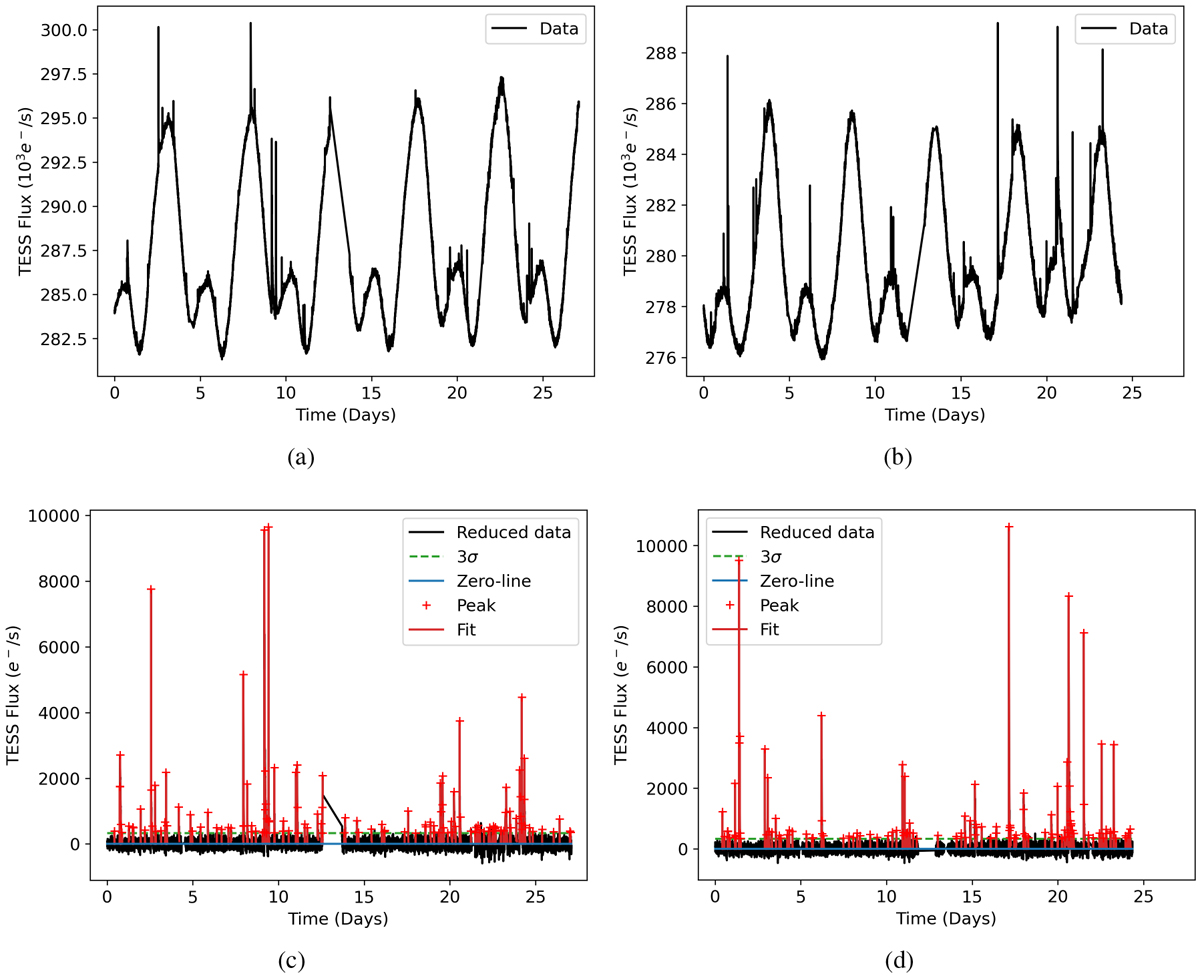
First step of the analysis of AU Mic. Top panels a,b show the three initial light curves (Sector 1 and 27 respectively). Bottom panels c,d show the final RCs after the GP analysis. The red crosses show the peaks of each event identified and the red lines the fits for each event. The dotted green line shows the 3a value and the blue line is the zero-line.
Current usage metrics show cumulative count of Article Views (full-text article views including HTML views, PDF and ePub downloads, according to the available data) and Abstracts Views on Vision4Press platform.
Data correspond to usage on the plateform after 2015. The current usage metrics is available 48-96 hours after online publication and is updated daily on week days.
Initial download of the metrics may take a while.