Fig. 12
Download original image
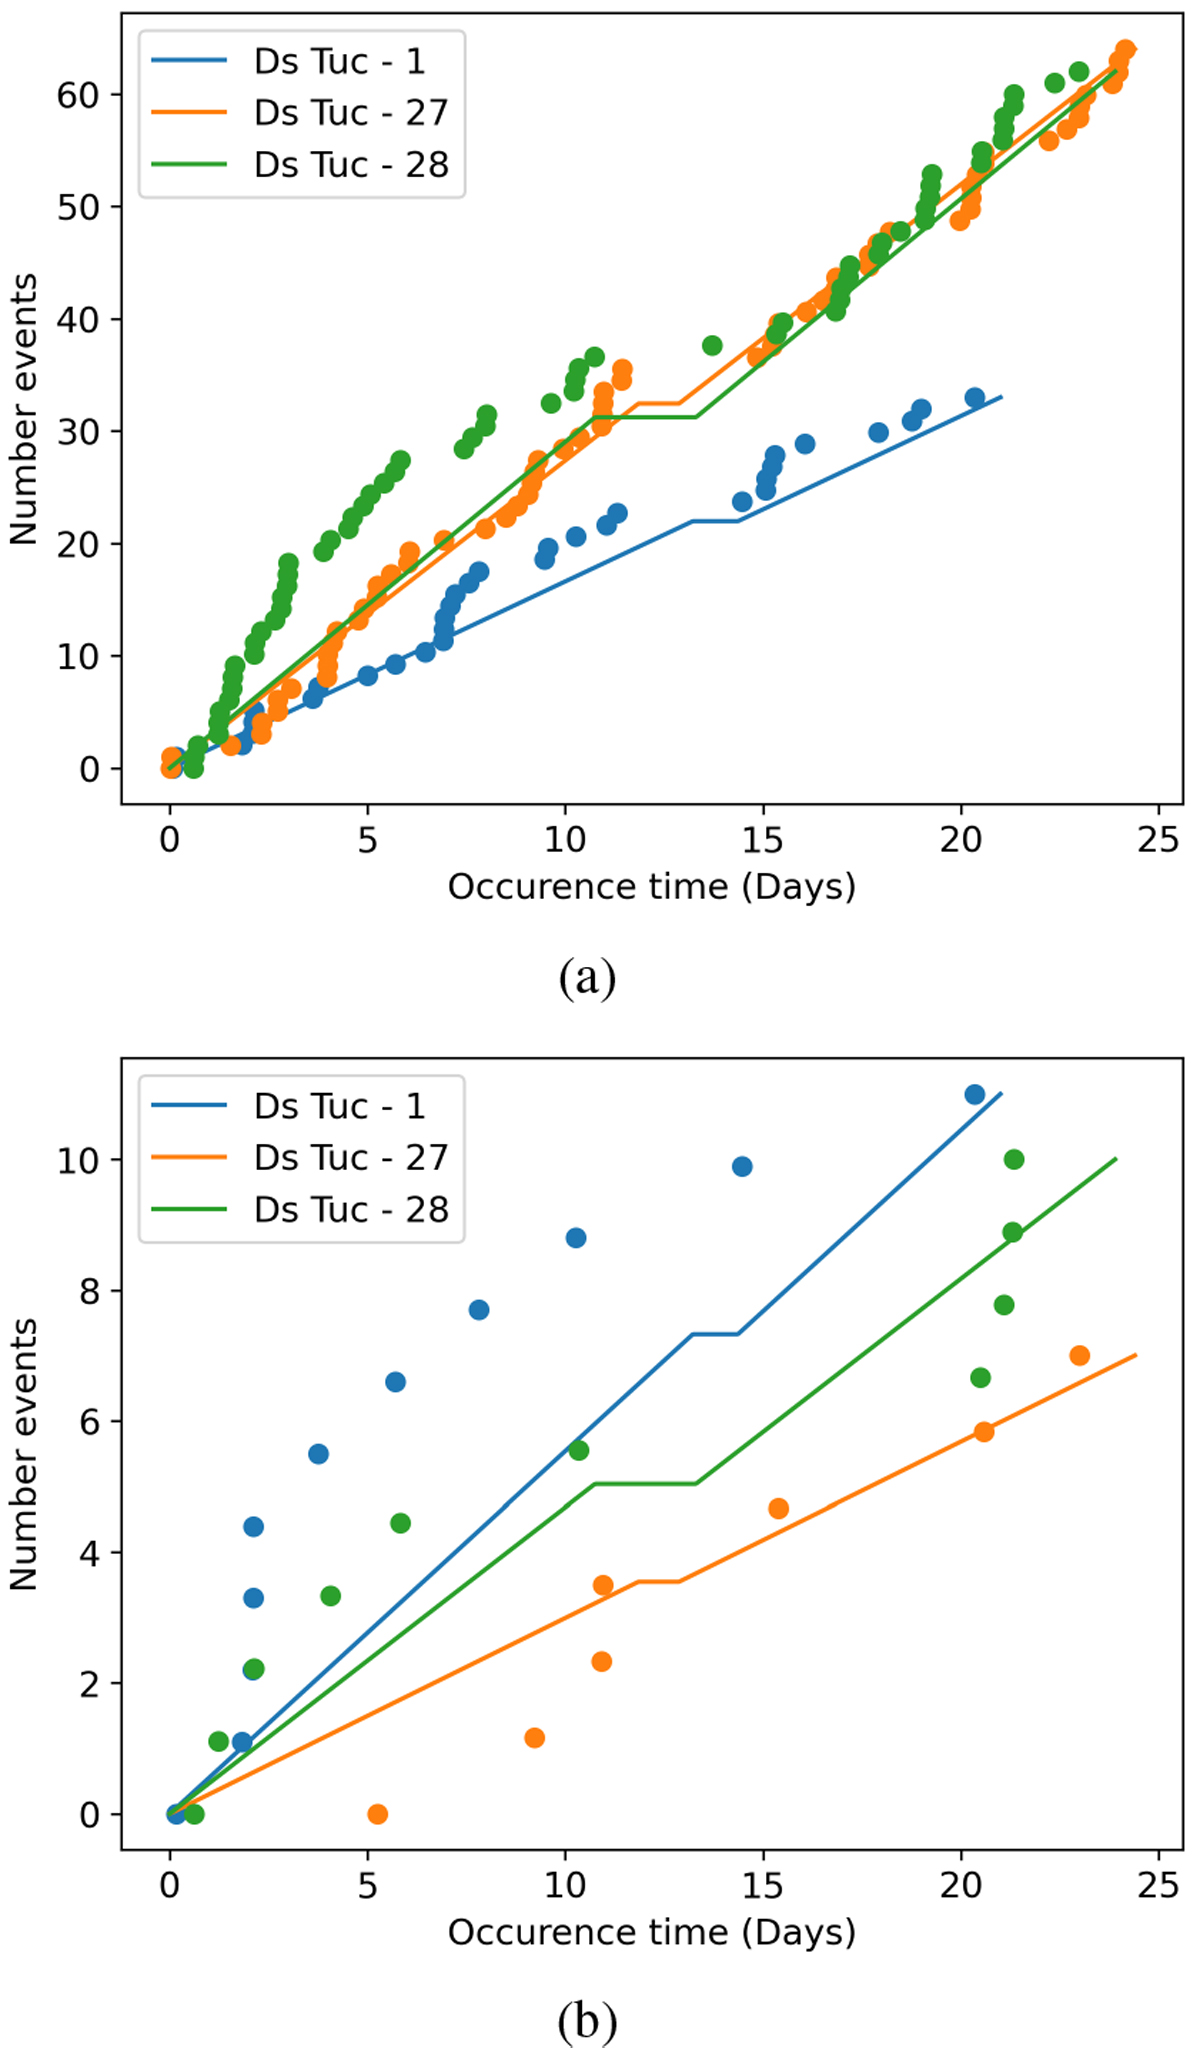
Expected vs observed event distribution during the observed period for the three sectors of DS Tuc. The χ-axis shows the occurrence time of each energetic event, the y-axis shows the number of the events. The dots represent the real data, the solid lines represent an equally time-spaced distribution. Top panel a: all the events, bottom panel b: only events with associated energy greater than 1034 erg.
Current usage metrics show cumulative count of Article Views (full-text article views including HTML views, PDF and ePub downloads, according to the available data) and Abstracts Views on Vision4Press platform.
Data correspond to usage on the plateform after 2015. The current usage metrics is available 48-96 hours after online publication and is updated daily on week days.
Initial download of the metrics may take a while.