Fig. 10
Download original image
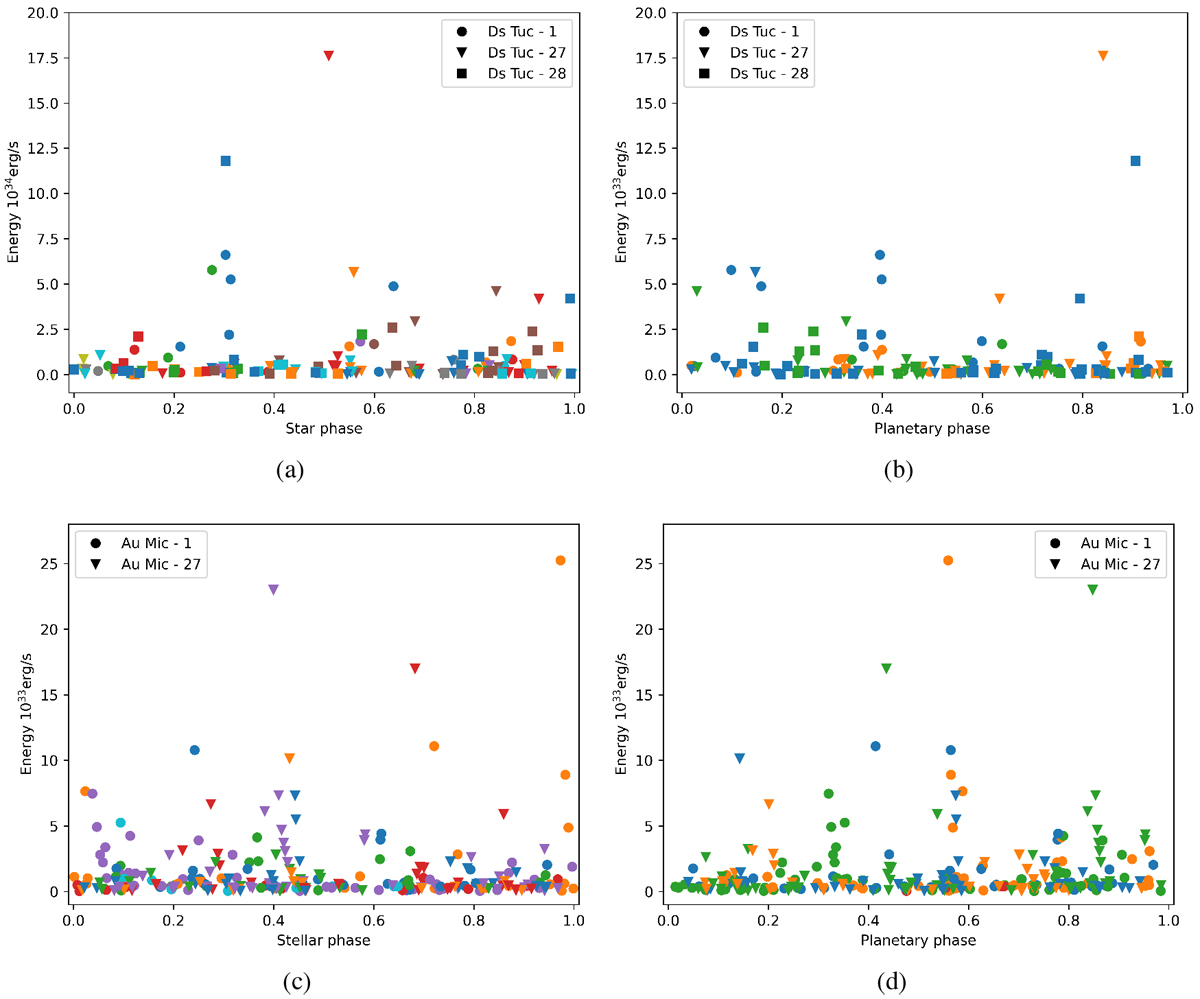
Phase plots for the events. Top left panel a: event energy vs. event position phase-folded for the stellar rotation cycles for DS Tuc A. Top right panel b: same as the left panel but for the planetary period. Bottom panels are as in top panels but for AU Mic. Different symbols refer to different TESS sectors, while different colours represent different stellar or planetary periods.
Current usage metrics show cumulative count of Article Views (full-text article views including HTML views, PDF and ePub downloads, according to the available data) and Abstracts Views on Vision4Press platform.
Data correspond to usage on the plateform after 2015. The current usage metrics is available 48-96 hours after online publication and is updated daily on week days.
Initial download of the metrics may take a while.