Free Access
Fig. 12
Download original image
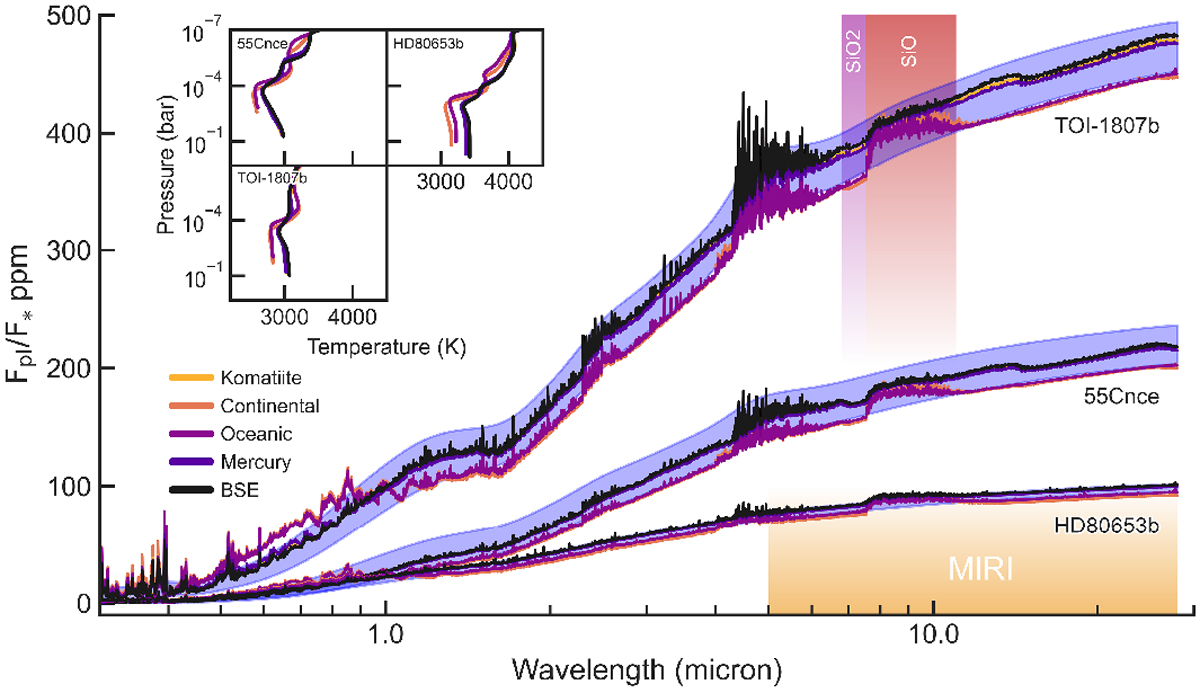
Same as Fig. 11, but for 60% vaporised melts shown at R = 800. For each planet, different coloured curves represent different melt compositions. The blue shaded regions represent blackbody emission boundaries between Bulk Silicate Earth and Oceanic compositions. Temperature profiles are given in the inset.
Current usage metrics show cumulative count of Article Views (full-text article views including HTML views, PDF and ePub downloads, according to the available data) and Abstracts Views on Vision4Press platform.
Data correspond to usage on the plateform after 2015. The current usage metrics is available 48-96 hours after online publication and is updated daily on week days.
Initial download of the metrics may take a while.