Fig. 11
Download original image
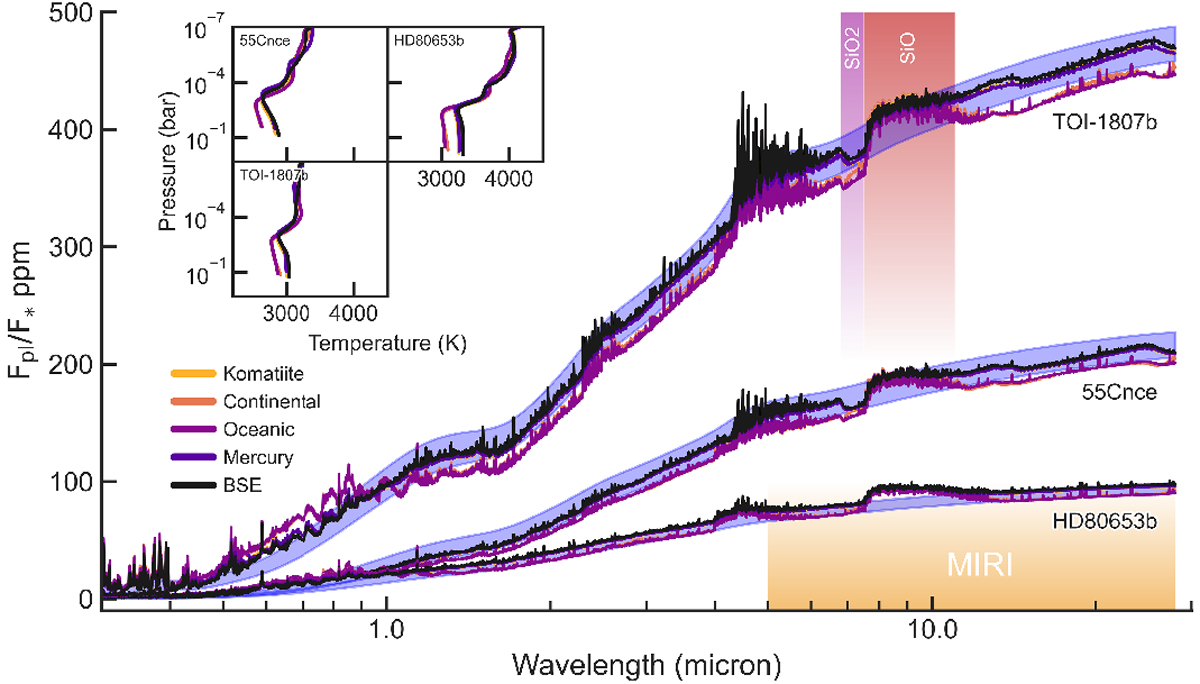
Emission spectra for different melt compositions at R = 800. The shown planets are: TOI-1807 b; 55 Cnc e; HD 806563 b. For each planet different colours indicate varying melt compositions, while the black curves represent Bulk Silicate Earth melts. Corresponding temperature profiles for each of the compositions are show in the inset. The blue shaded region represents variation in surface temperature, which in this case is largest between Bulk Silicate Earth and Oceanic comps.
Current usage metrics show cumulative count of Article Views (full-text article views including HTML views, PDF and ePub downloads, according to the available data) and Abstracts Views on Vision4Press platform.
Data correspond to usage on the plateform after 2015. The current usage metrics is available 48-96 hours after online publication and is updated daily on week days.
Initial download of the metrics may take a while.