Fig. 4
Download original image
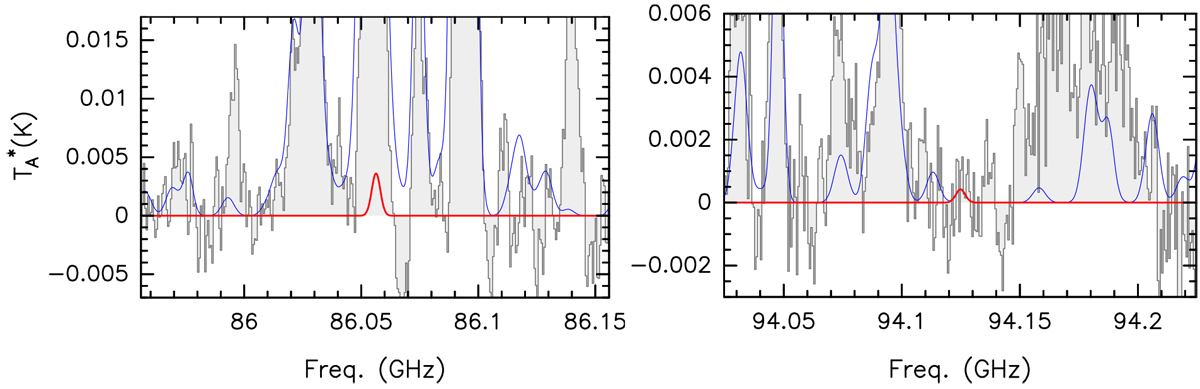
Selected transitions of the gGt conformer of cysteamine in the spectral survey toward the G+0.693–0.027 molecular cloud. Left panel: brightest spectral feature of gGt-cysteamine, composed of six blended transitions at 86.05–86.06 GHz (44–33, Elo = 3.89 cm–1), predicted by the LTE spectrum obtained considering the upper limit of the column density (see Table 4). These gOt-cysteamine transitions appear heavily blended with a much brighter line produced by HC15N(1–0) at 86.05496 GHz. Right panel: brightest predicted spectral feature of gGt-cysteamine (composed by three transitions at 94.124 GHz; Elo = 6.93 cm–1; Table 4) that is not blended with emission from other molecules. We used these transitions to compute the upper limit for the column density of gGt-cysteamine (Table 4). In both panels, the gray histogram shows the observed spectrum, the blue curve shows the contribution of all the molecules previously identified in the molecular cloud G+0.693–0.027, and red plots the LTE spectrum of the gGt conformer of cysteamine obtained with the upper limit for its column density (Table 4).
Current usage metrics show cumulative count of Article Views (full-text article views including HTML views, PDF and ePub downloads, according to the available data) and Abstracts Views on Vision4Press platform.
Data correspond to usage on the plateform after 2015. The current usage metrics is available 48-96 hours after online publication and is updated daily on week days.
Initial download of the metrics may take a while.