Fig. 6
Download original image
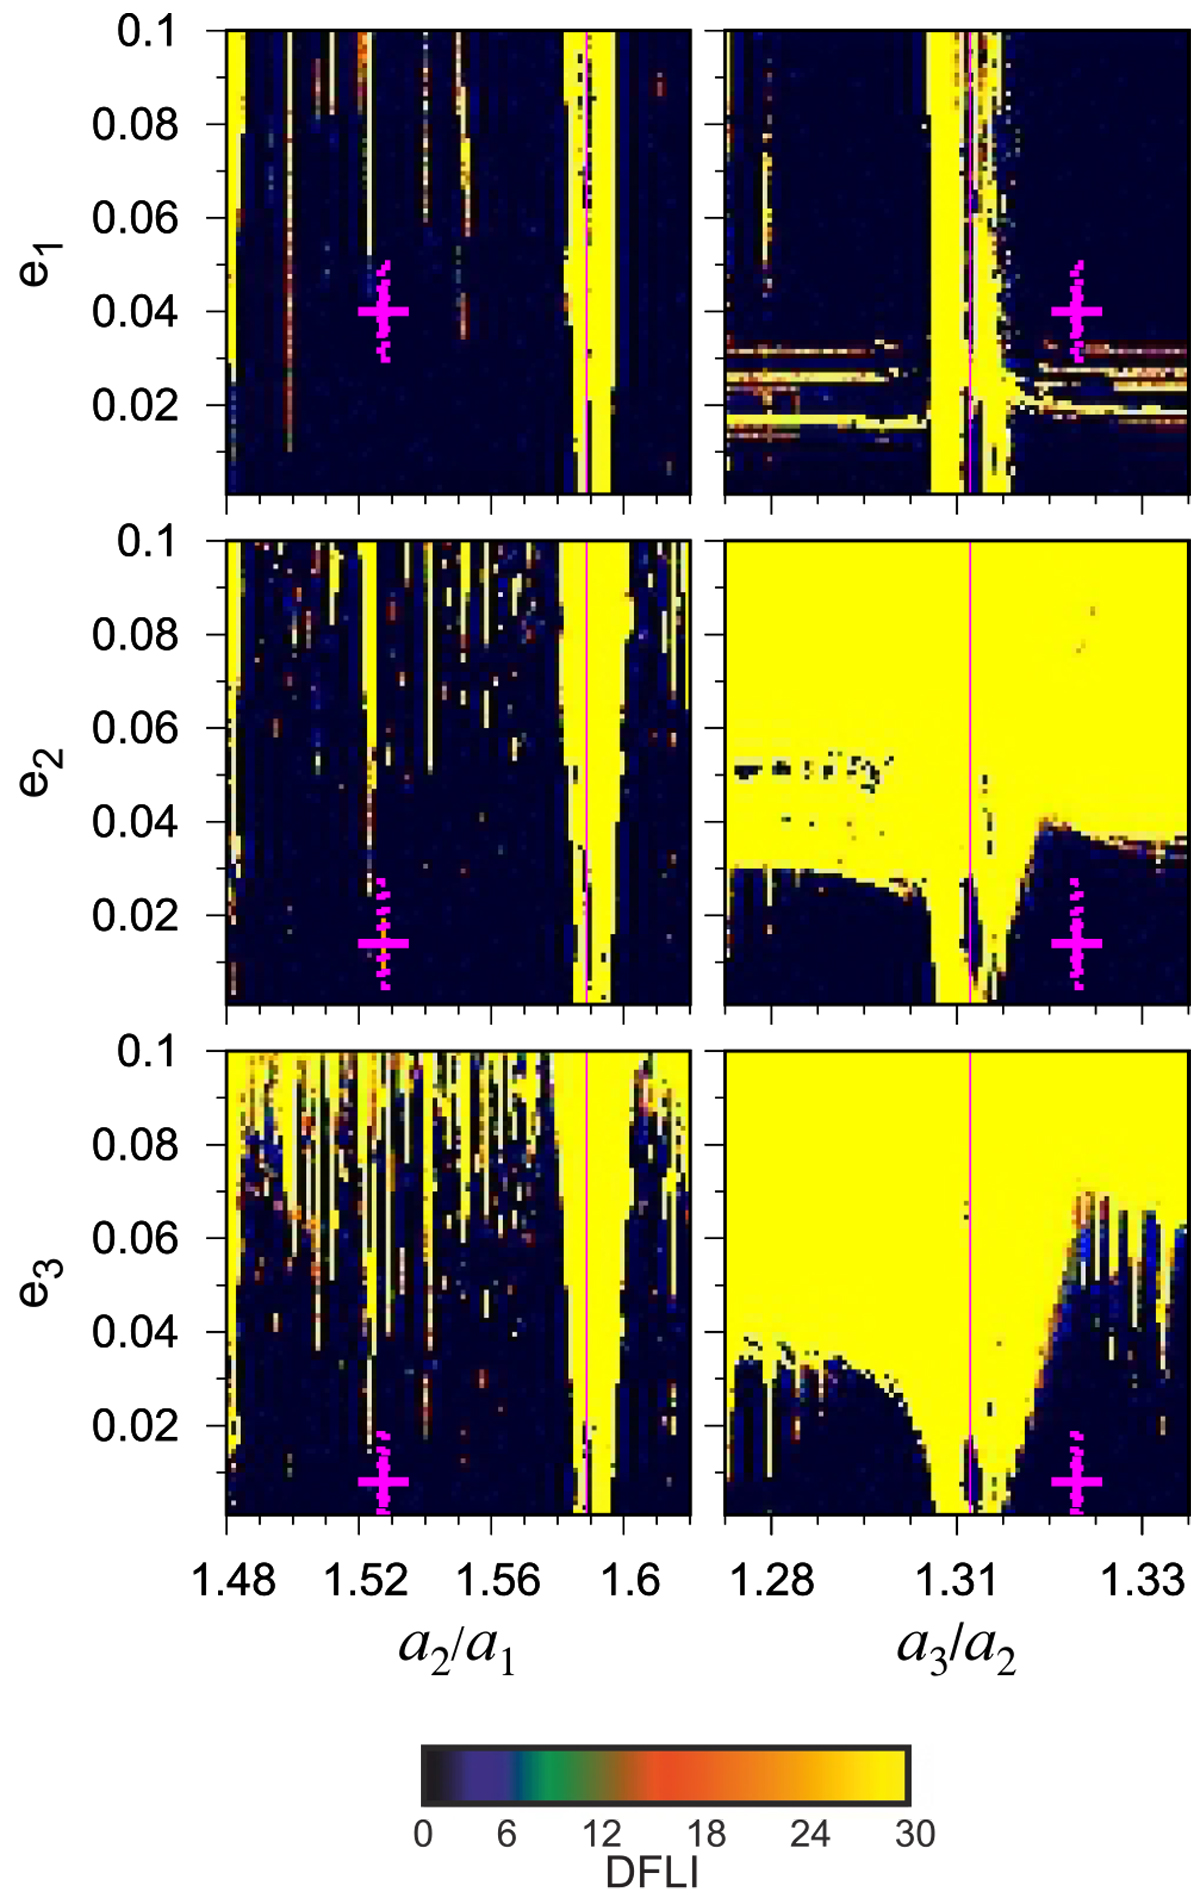
DS-maps that showcase the extent of the 2/1 (left panels) and the 3/2 (right panels) distinct RL regions appear at the values![]() . The magenta lines showcase the nominal values of each MMR. The system Kepler-51 (magenta dashed lines enclosing the “+” symbol) is found at
. The magenta lines showcase the nominal values of each MMR. The system Kepler-51 (magenta dashed lines enclosing the “+” symbol) is found at ![]() , where an apsidal resonance takes place. Colors and lines as in Fig. 3.
, where an apsidal resonance takes place. Colors and lines as in Fig. 3.
Current usage metrics show cumulative count of Article Views (full-text article views including HTML views, PDF and ePub downloads, according to the available data) and Abstracts Views on Vision4Press platform.
Data correspond to usage on the plateform after 2015. The current usage metrics is available 48-96 hours after online publication and is updated daily on week days.
Initial download of the metrics may take a while.