Fig. 9.

Download original image
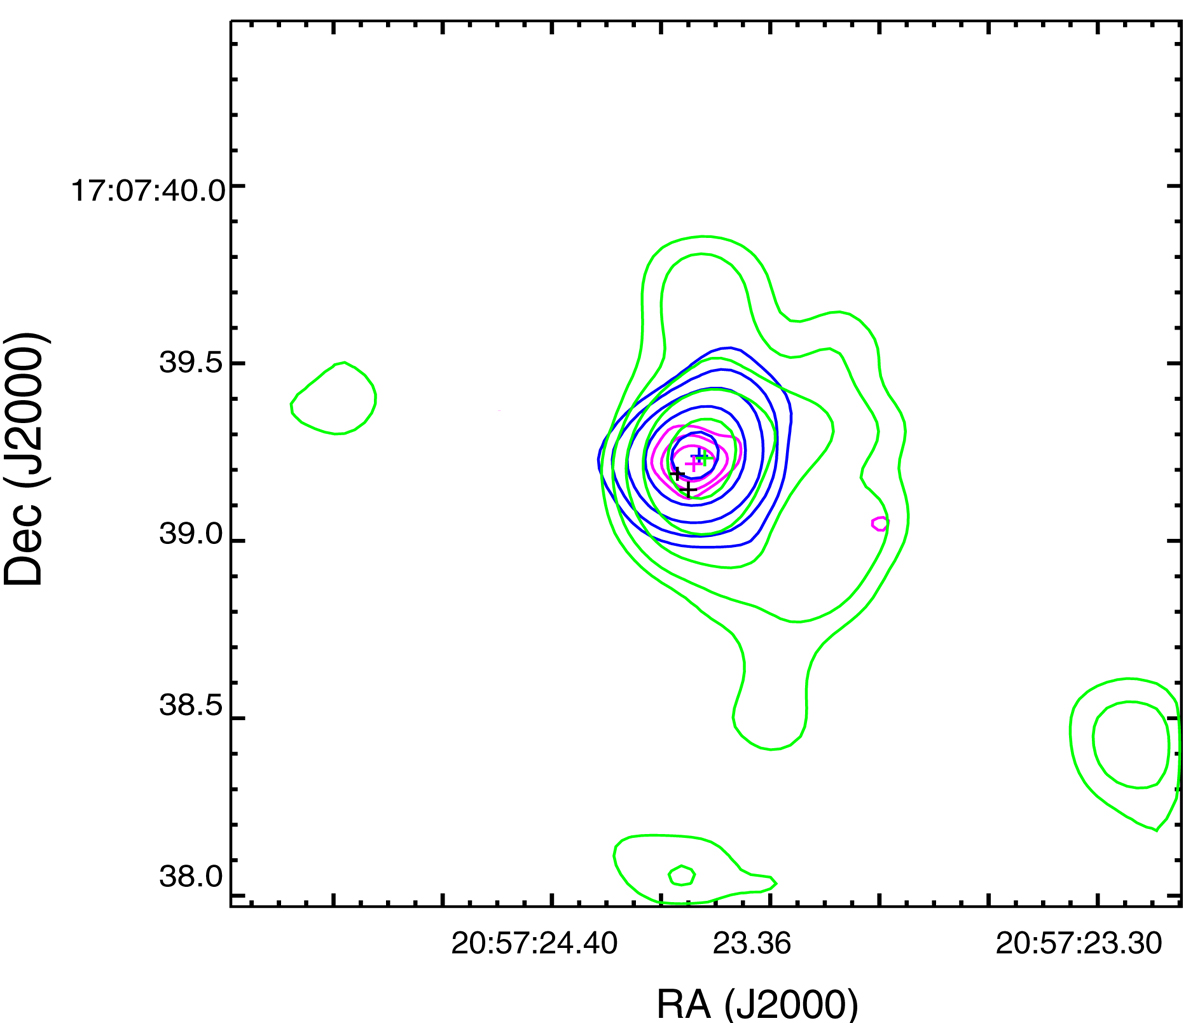
High-resolution radio contour images of the continuum and molecular line emission. The two black crosses are the OH emission regions OH1 and OH2 shown in Fig. 1, and the colored crosses correspond to the following center coordinate positions: The blue line is the HCO+ emission contour averaged channels with velocity in the range 10763.3–11031.8 km s−1, with the contour level: 0.00075 × (1, 2, 4, 8, 16) Jy beam−1; the magenta contour represents the continuum emission from the 33 GHz VLA-A observation with contour level: 0.0000441 × (1, 2, 4, 8) Jy beam−1; the green contour is the CO line emission at the channel with a peak velocity about 10 887 km s−1, with contour: 0.0063 × (1, 2, 4, 8, 16) Jy beam−1.
Current usage metrics show cumulative count of Article Views (full-text article views including HTML views, PDF and ePub downloads, according to the available data) and Abstracts Views on Vision4Press platform.
Data correspond to usage on the plateform after 2015. The current usage metrics is available 48-96 hours after online publication and is updated daily on week days.
Initial download of the metrics may take a while.


