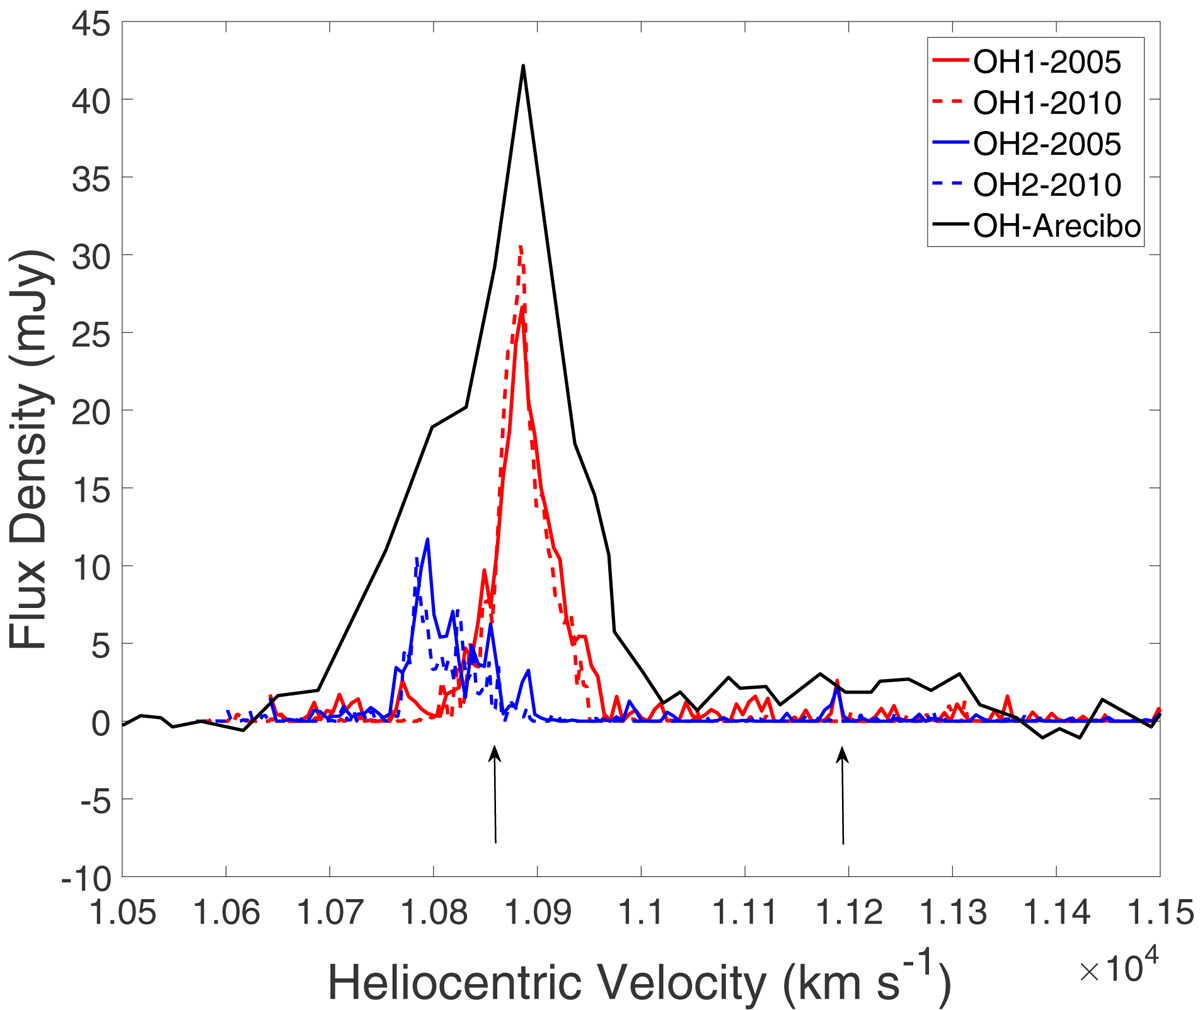
Fig. 2.

Download original image
Integrated OH line profiles of IIZw 096. The red and blue spectra were obtained by integrating the signals above 3σ over two OH emission regions (OH1 and OH2, see Fig. 1) from each channel image of the two EVN line observations listed in Table 1. The black spectrum is the OH profile from Arecibo observations by Baan et al. (1989). The two arrows represent the velocity of the OH 1667 MHz (left) and 1665 MHz (right) lines based on the optical redshift.
Current usage metrics show cumulative count of Article Views (full-text article views including HTML views, PDF and ePub downloads, according to the available data) and Abstracts Views on Vision4Press platform.
Data correspond to usage on the plateform after 2015. The current usage metrics is available 48-96 hours after online publication and is updated daily on week days.
Initial download of the metrics may take a while.


