Fig. 1.

Download original image
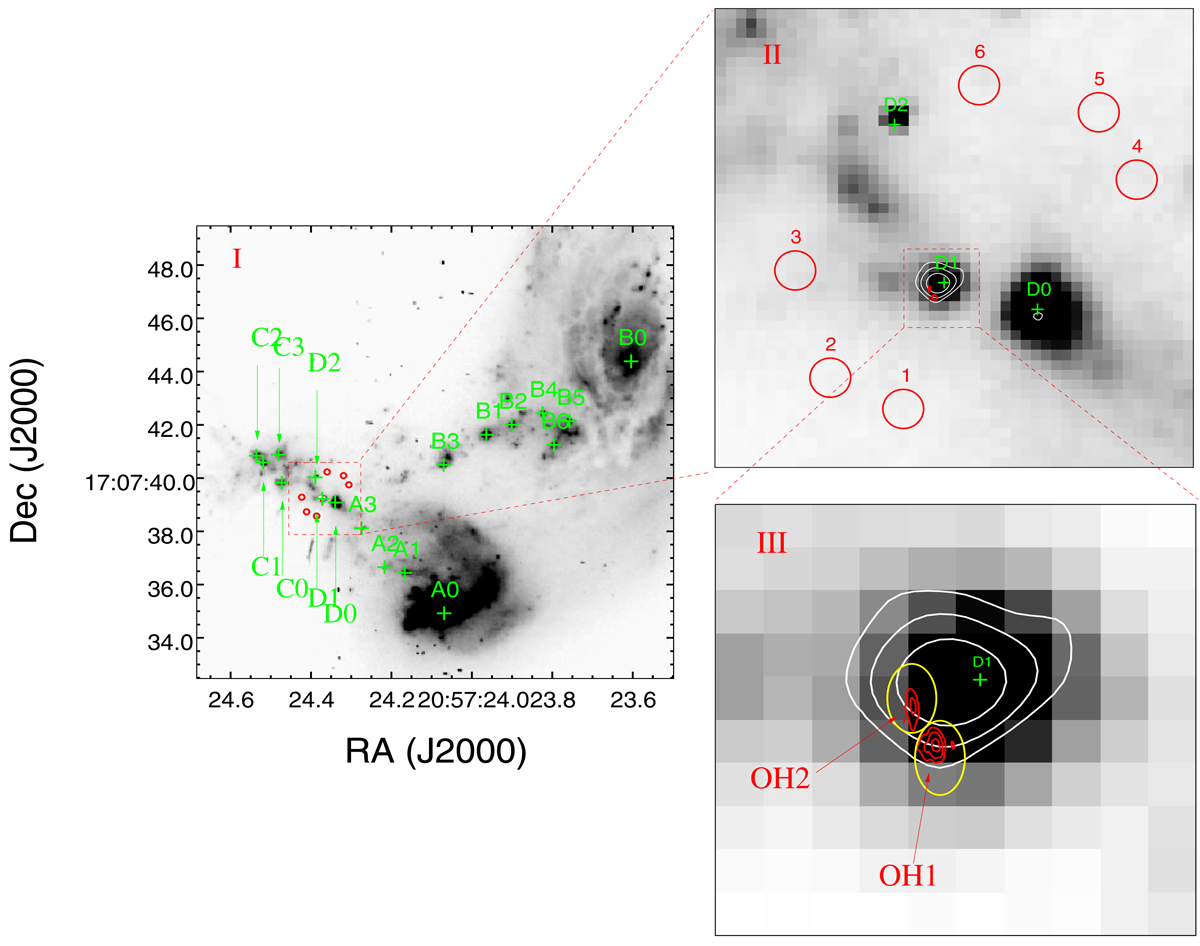
Particular spots, regions, and contours superimposed on an HST image of IIZw 096. Panel I: HST-ACS F814W image (grayscale) for IIZw 096. The green crosses indicate the bright spots in this optical image. Panel II: VLA (A configuration) contour map at 33 GHz (white line) overlaid on the HST image. The contour levels are 0.0000441 × (1, 2, 4, 8) Jy beam−1 and the beam FWHM is 82.4 × 59.5 (mas) at −69.1°. The red circles show the regions around the comp D1, and the radius is about 0.1 arcsec. The red contour stands for the OH megamaser emission (red) from EVN archival data (project ES064B) (see details of the image parameters of the OH emission in Fig. A.2). Panel III: Zoomed-in map of the D1 region from panel II. The yellow ellipses are the two regions where we extracted the integrated OH emission lines.
Current usage metrics show cumulative count of Article Views (full-text article views including HTML views, PDF and ePub downloads, according to the available data) and Abstracts Views on Vision4Press platform.
Data correspond to usage on the plateform after 2015. The current usage metrics is available 48-96 hours after online publication and is updated daily on week days.
Initial download of the metrics may take a while.


