Fig. 4.
Download original image
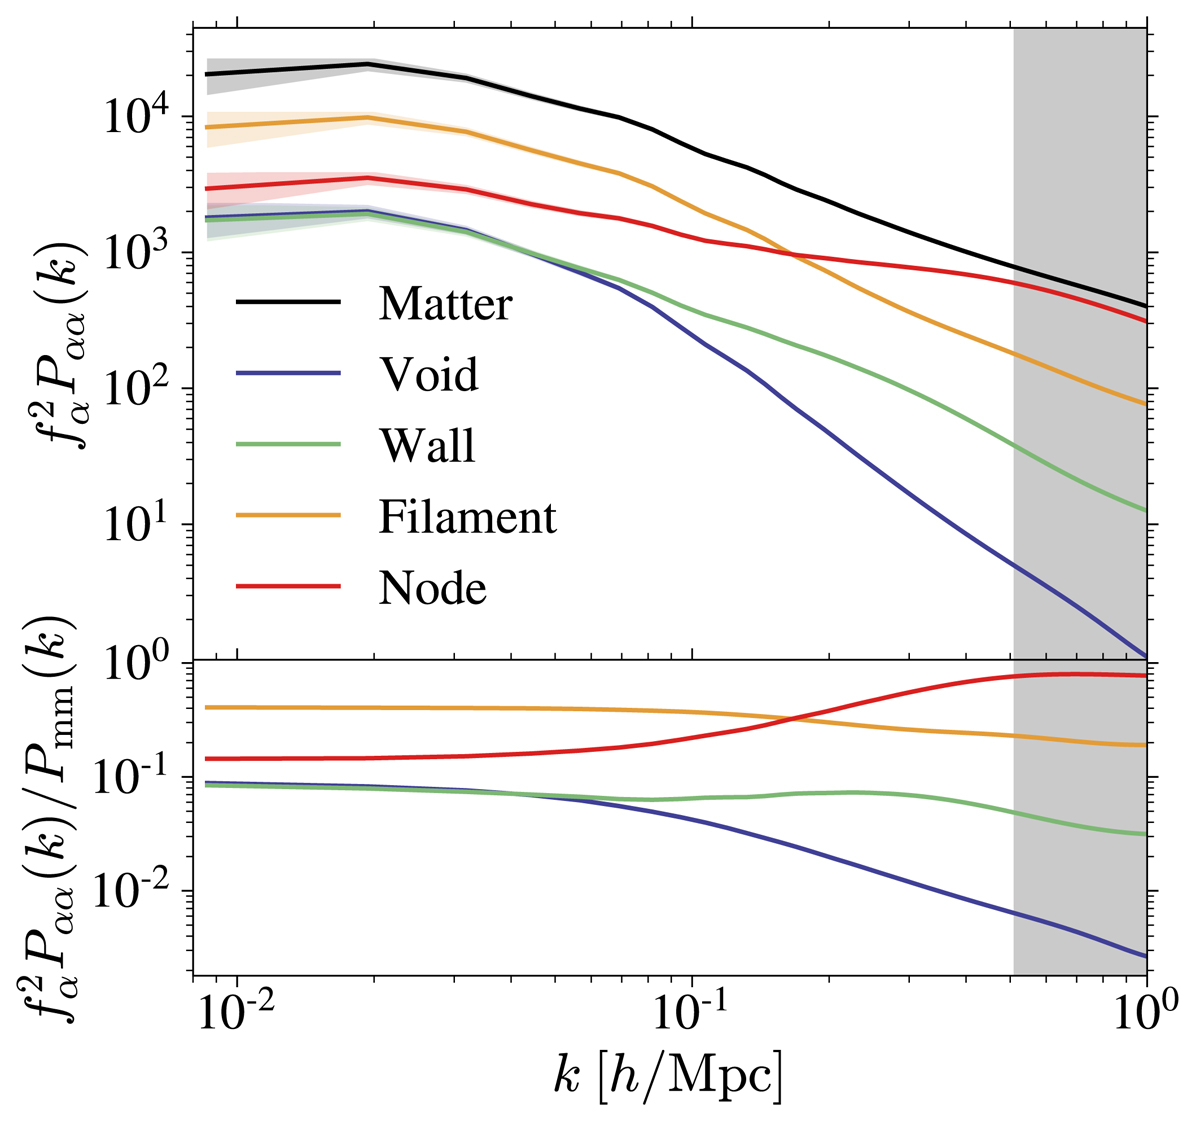
Top panel: real-space normalised power spectra ![]() obtained for each environment α ∈ {v, w, f, n} compared to the one from all dark-matter particles in black. Solid lines are the average over the Nfid = 7000 fiducial simulations and the shaded areas are the 1-σ intervals. The grey area depicts the range of k > kmax excluded from the analysis. In the bottom panel are found the ratios between the averaged normalised spectra in each environment and the matter–matter spectrum (black from the top panel).
obtained for each environment α ∈ {v, w, f, n} compared to the one from all dark-matter particles in black. Solid lines are the average over the Nfid = 7000 fiducial simulations and the shaded areas are the 1-σ intervals. The grey area depicts the range of k > kmax excluded from the analysis. In the bottom panel are found the ratios between the averaged normalised spectra in each environment and the matter–matter spectrum (black from the top panel).
Current usage metrics show cumulative count of Article Views (full-text article views including HTML views, PDF and ePub downloads, according to the available data) and Abstracts Views on Vision4Press platform.
Data correspond to usage on the plateform after 2015. The current usage metrics is available 48-96 hours after online publication and is updated daily on week days.
Initial download of the metrics may take a while.