Fig. 8.
Download original image
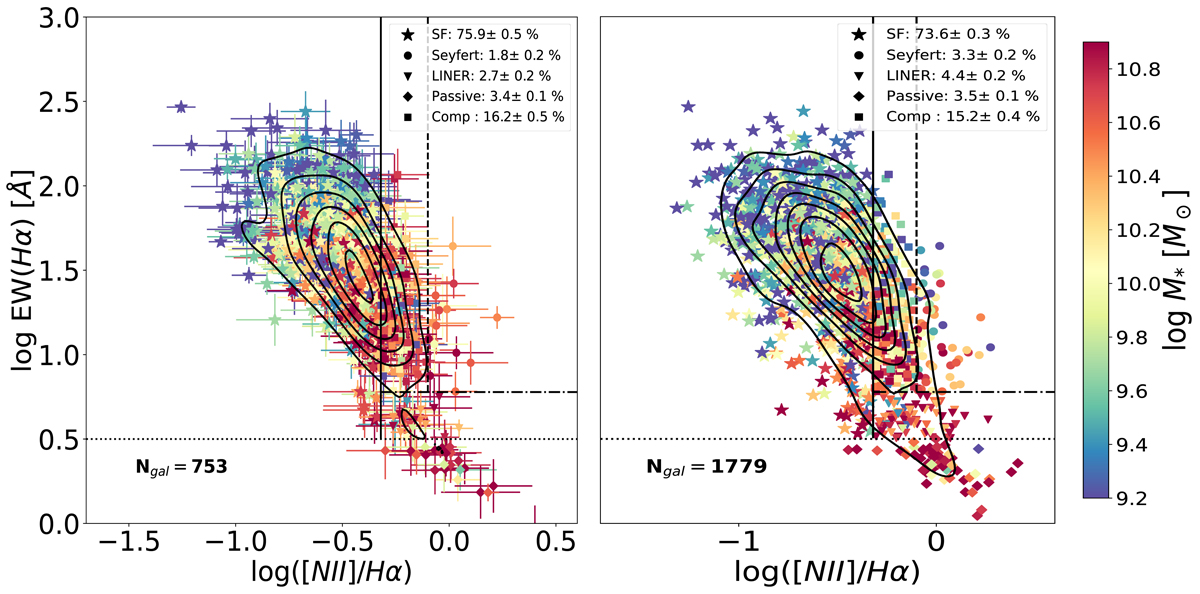
WHAN diagram for galaxies with an error smaller than 0.2 dex (0.5 dex) in both the EW(Hα) and the [N II]/Hα ratio in the left (right) panel. The errors are not shown in the right panel for clarity. The color bar indicates the stellar mass of the galaxy. The inset shows the relative percentage of each galaxy type in each subsample. Dashed and solid vertical lines define the optimal projections of the Ke01 and the Ka03 lines in the WHAN diagram (Cid Fernandes et al. 2010, 2011). Similarly, the dash-dotted horizontal line at EW(Hα) = 6 Å is the optimal transposition of the S07, and the dotted line at log EW(Hα) = 0.5 Å defines the limit of ELGs. In each panel, the galaxy counts are specified in the lower left corner. The parent sample contains 2154 galaxies. Density contours are drawn in black at the top.
Current usage metrics show cumulative count of Article Views (full-text article views including HTML views, PDF and ePub downloads, according to the available data) and Abstracts Views on Vision4Press platform.
Data correspond to usage on the plateform after 2015. The current usage metrics is available 48-96 hours after online publication and is updated daily on week days.
Initial download of the metrics may take a while.