Fig. 7.
Download original image
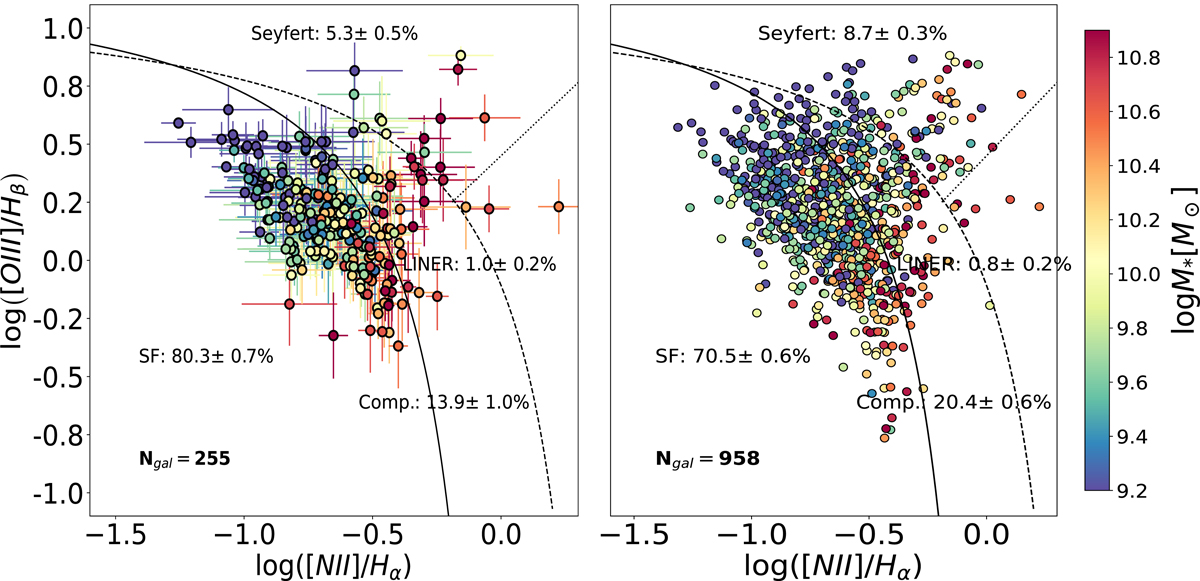
BPT diagram for the galaxies in the sample with an error of 0.2 dex (0.5 dex) in the [O III]/Hβ and [N II]/Hα ratios in the left (right) panel. The errors are not plotted in the right panel for clarity. The color bar indicates the stellar mass of the galaxy. The solid (Ka03), dashed (Ke01), and dotted lines (S07) define the regions for the four main spectral classes. The relative percentage of each galaxy type in each subsample is indicated in the figure. In each panel, the number of galaxies is specified in the lower left corner. The parent sample contains 2154 galaxies.
Current usage metrics show cumulative count of Article Views (full-text article views including HTML views, PDF and ePub downloads, according to the available data) and Abstracts Views on Vision4Press platform.
Data correspond to usage on the plateform after 2015. The current usage metrics is available 48-96 hours after online publication and is updated daily on week days.
Initial download of the metrics may take a while.