Fig. 6.
Download original image
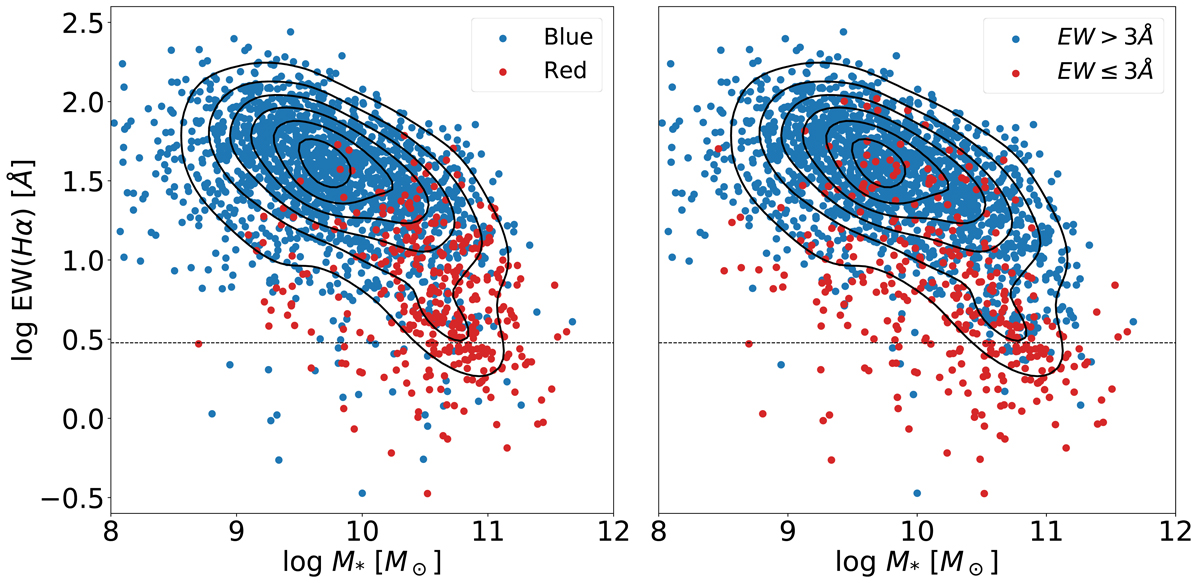
Equivalent width of Hα as a function of the stellar mass of the galaxy. Left panel: we used Eq. (2) to distinguish between red and blue galaxies. Right panel: we relied on the classification performed with a machine-learning code trained with strong EL and weak EL galaxies. Strong ELs were defined as those with EWs greater than 3 Å in any of the following emission lines: Hα, Hβ, [O III], or [N II], and weak ELs are all others. The dashed horizontal lines mark the 3 Å limit in the EW(Hα). Density contours are drawn in black at the top.
Current usage metrics show cumulative count of Article Views (full-text article views including HTML views, PDF and ePub downloads, according to the available data) and Abstracts Views on Vision4Press platform.
Data correspond to usage on the plateform after 2015. The current usage metrics is available 48-96 hours after online publication and is updated daily on week days.
Initial download of the metrics may take a while.