Fig. 17.
Download original image
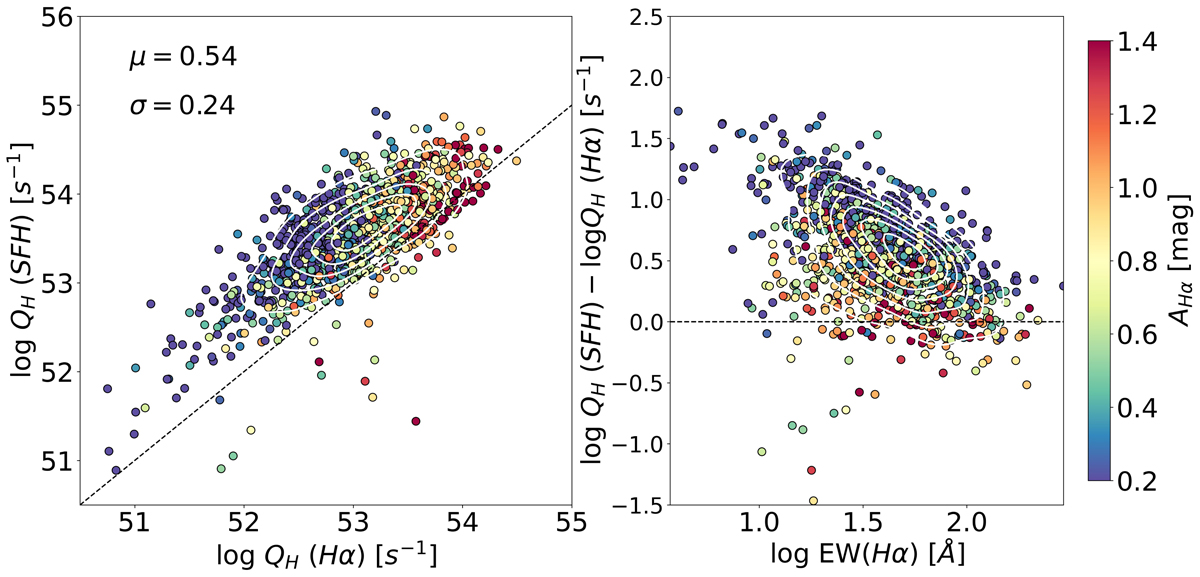
Comparison of the ionizing photon rates computed from Hα emission line and from the fit obtained with the analysis of the stellar populations with BaySeAGal (left; see text in Sect. 6.3). The dashed black line represents the 1:1 relation. μ and σ are the bias and the standard deviation. Right panel: difference between these quantities as a function of the EW of Hα. Density contours are drawn in black. In both cases, the galaxies are color-coded with the extinction of the interstellar gas calculated from the Balmer decrement.
Current usage metrics show cumulative count of Article Views (full-text article views including HTML views, PDF and ePub downloads, according to the available data) and Abstracts Views on Vision4Press platform.
Data correspond to usage on the plateform after 2015. The current usage metrics is available 48-96 hours after online publication and is updated daily on week days.
Initial download of the metrics may take a while.