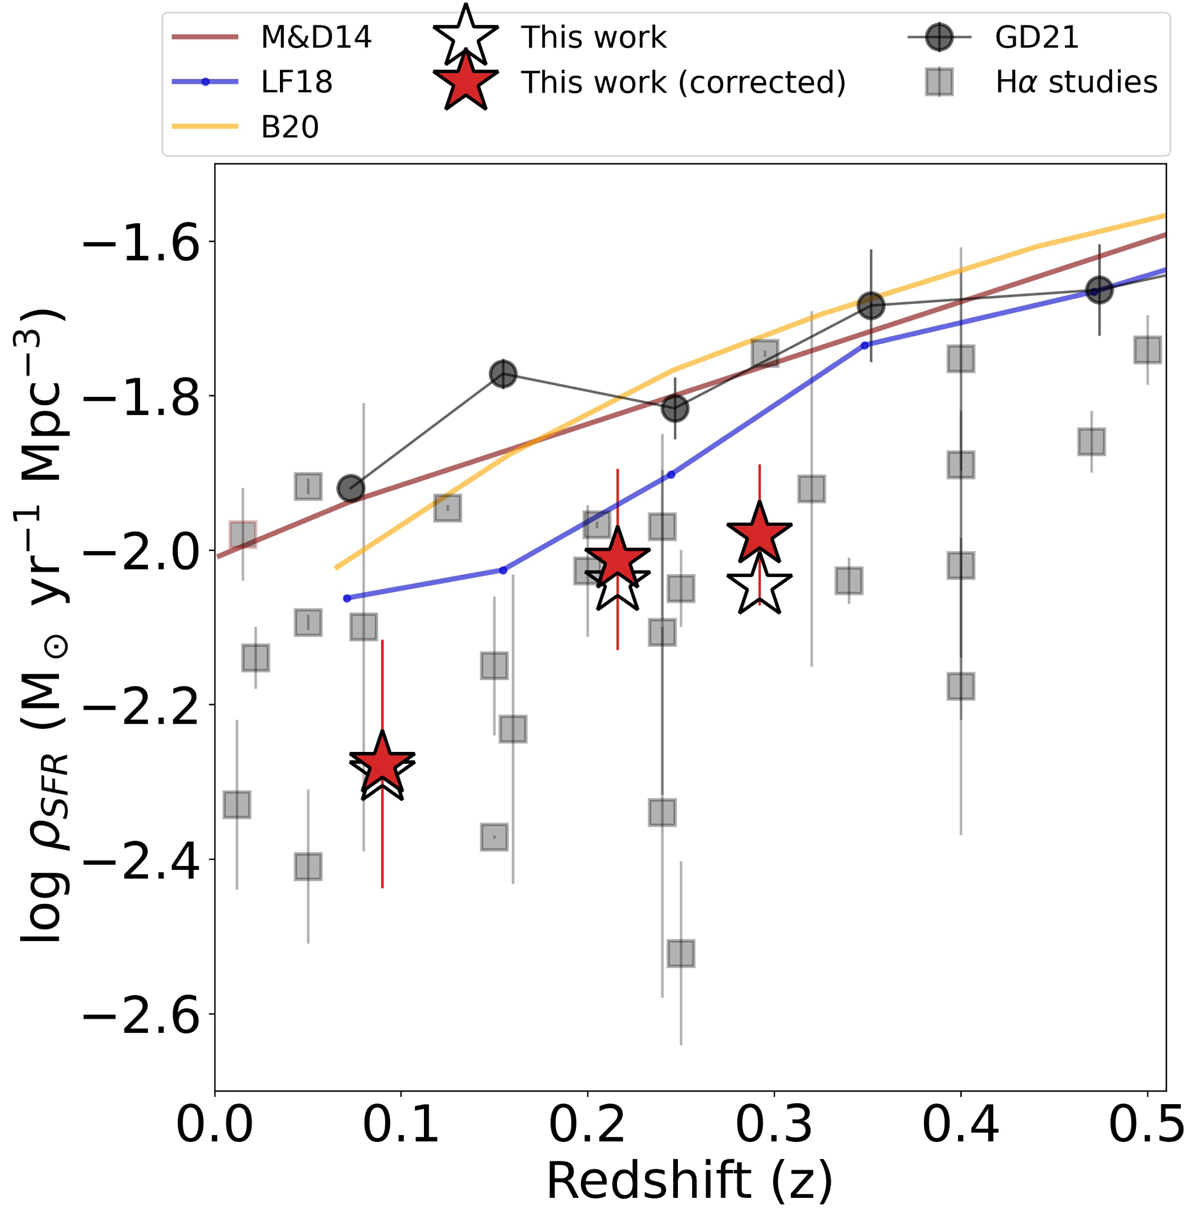
Fig. 16.
Download original image
Star formation rate density at z < 0.35. Red stars show the values obtained in this work from the luminosity of Hα. Empty stars are uncorrected values that do not take galaxies with undetectable nebular emission lines or with very low S/N (see text in Sect. 6.2) into account. Black circles are the values obtained by González Delgado et al. (2021) applying the fossil record method to a sample of miniJPAS galaxies in the range 0.05 < z ≤ 0.15. Squares are studies based on Hα (see references in Table 3). Solid lines represents the trends obtained by different studies based on the stellar continuum: Madau & Dickinson (2014, M&D14), López Fernández et al. (2018, LF18), and Bellstedt et al. (2020, B20). All values are scaled to the Chabrier (2003) IMF.
Current usage metrics show cumulative count of Article Views (full-text article views including HTML views, PDF and ePub downloads, according to the available data) and Abstracts Views on Vision4Press platform.
Data correspond to usage on the plateform after 2015. The current usage metrics is available 48-96 hours after online publication and is updated daily on week days.
Initial download of the metrics may take a while.