Fig. 14.
Download original image
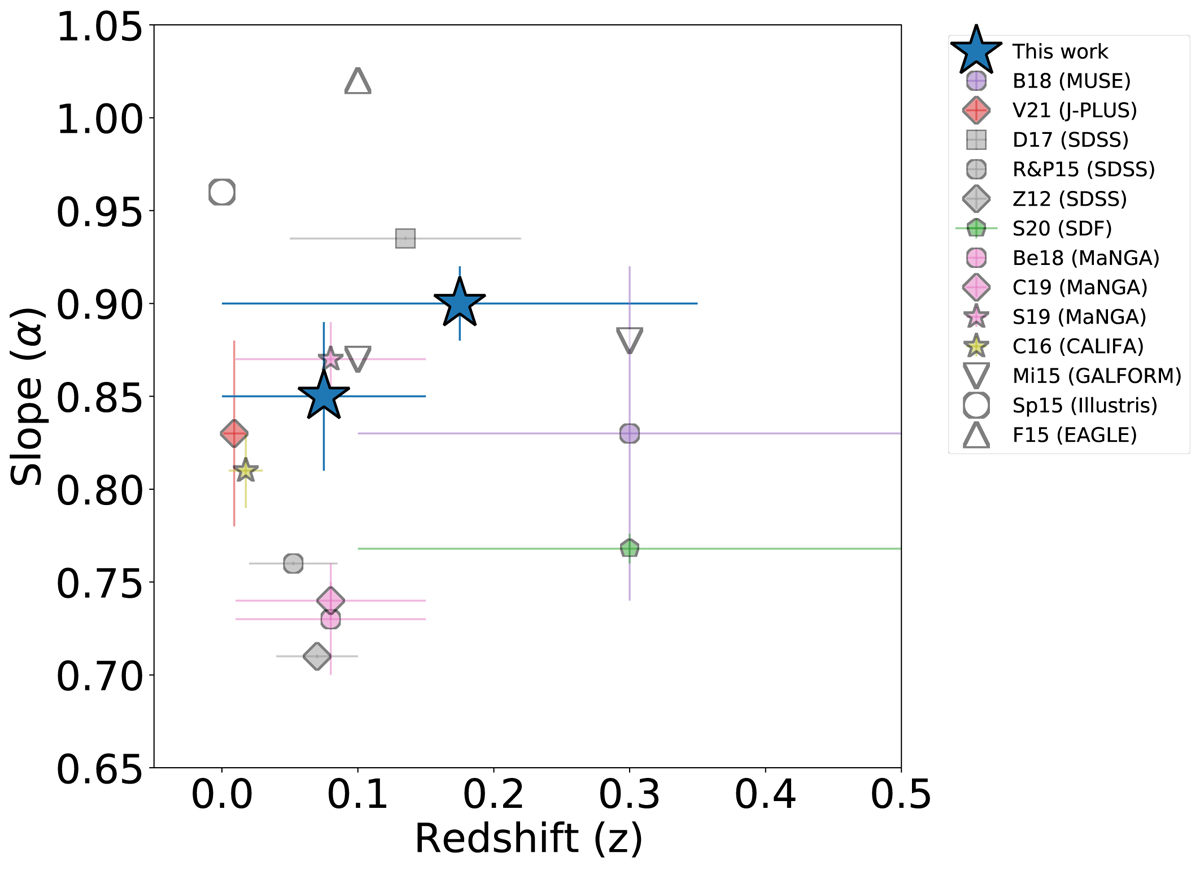
Slope of the SFMS derived from the Hα emission line by different works as a function of the redshift. The bars on the x-axis represent the redshift range of the galaxies involved in each study. Our best fit of the SFMS is shown with large blue stars for the lowest redshift range (0 < z ≤ 0.15) and the SF sample (0 < z ≤ 0.35). The results of the literature are from Boogaard et al. (2018) (B18), Vilella-Rojo et al. (2021) (V21), Duarte Puertas et al. (2017) (D17), Renzini & Peng (2015) (R&P15), Zahid et al. (2012) (Z12), Shin et al. (2021) (S20), Belfiore et al. (2018) (Be18), Cano-Díaz et al. (2019) (C19), Sánchez et al. (2019) (S19), and Cano-Díaz et al. (2016) (C16). We also include the results derived by GALFROM (a semianalytical model) (Mitchell et al. 2014) (Mi15), and from hydrodynamical simulations, Sparre et al. (2015) (Sp15) and Furlong et al. (2015) (F15).
Current usage metrics show cumulative count of Article Views (full-text article views including HTML views, PDF and ePub downloads, according to the available data) and Abstracts Views on Vision4Press platform.
Data correspond to usage on the plateform after 2015. The current usage metrics is available 48-96 hours after online publication and is updated daily on week days.
Initial download of the metrics may take a while.