Fig. 11.
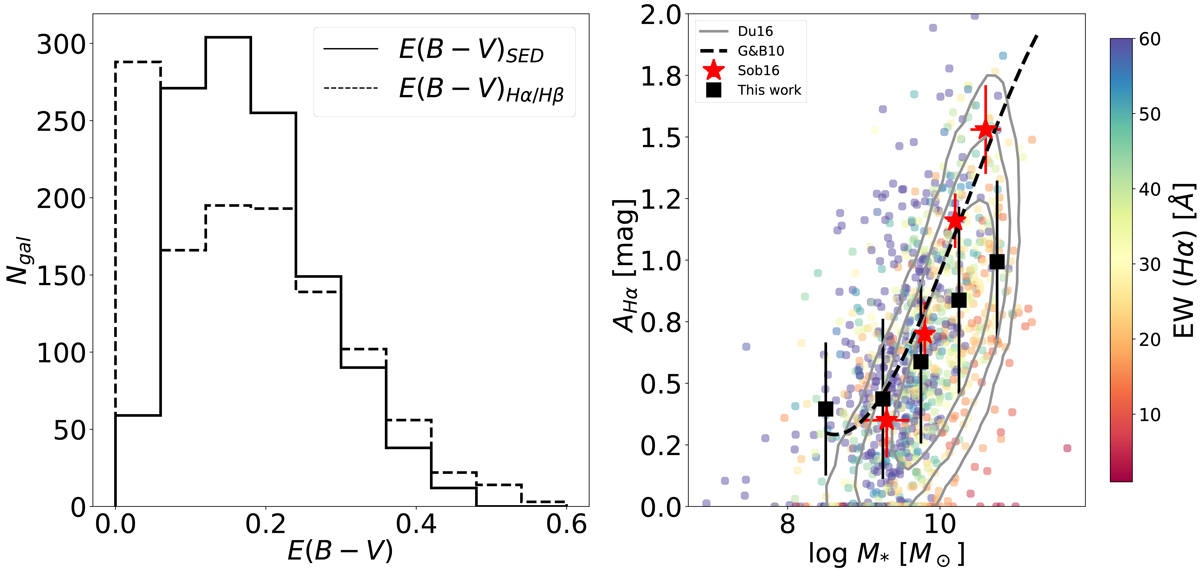
Download original image
Distribution of the nebular (E(B − V)Hα/Hβ) and stellar (E(B − V)SED) color excess (left). Nebular extinction at the Hα wavelength as a function of stellar mass (right). Galaxies are color-coded with the EW of Hα and belong the SF sample described in Sect. 5.1. Black squares are the median obtained in the following stellar mass bins: 8 < log M* ≤ 9, 9 < log M* ≤ 9.5, 9.5 < log M* ≤ 10, 10 < log M* ≤ 10.5, and 10.5 < log M* ≤ 11. The error bars on the y-axis represent the standard deviation, gray contours represent the density of sources for 1σ, 2σ, and 3σ derived from SDSS galaxies in Duarte Puertas et al. (2017). Red stars are the values obtained by Sobral et al. (2016) by means of spectroscopy measurements in SF galaxies within the cluster CL 0939+4713 at z = 0.41. The dashed black line is the best polynomial fit obtained by Garn & Best (2010) in a sample of SDSS galaxies.
Current usage metrics show cumulative count of Article Views (full-text article views including HTML views, PDF and ePub downloads, according to the available data) and Abstracts Views on Vision4Press platform.
Data correspond to usage on the plateform after 2015. The current usage metrics is available 48-96 hours after online publication and is updated daily on week days.
Initial download of the metrics may take a while.