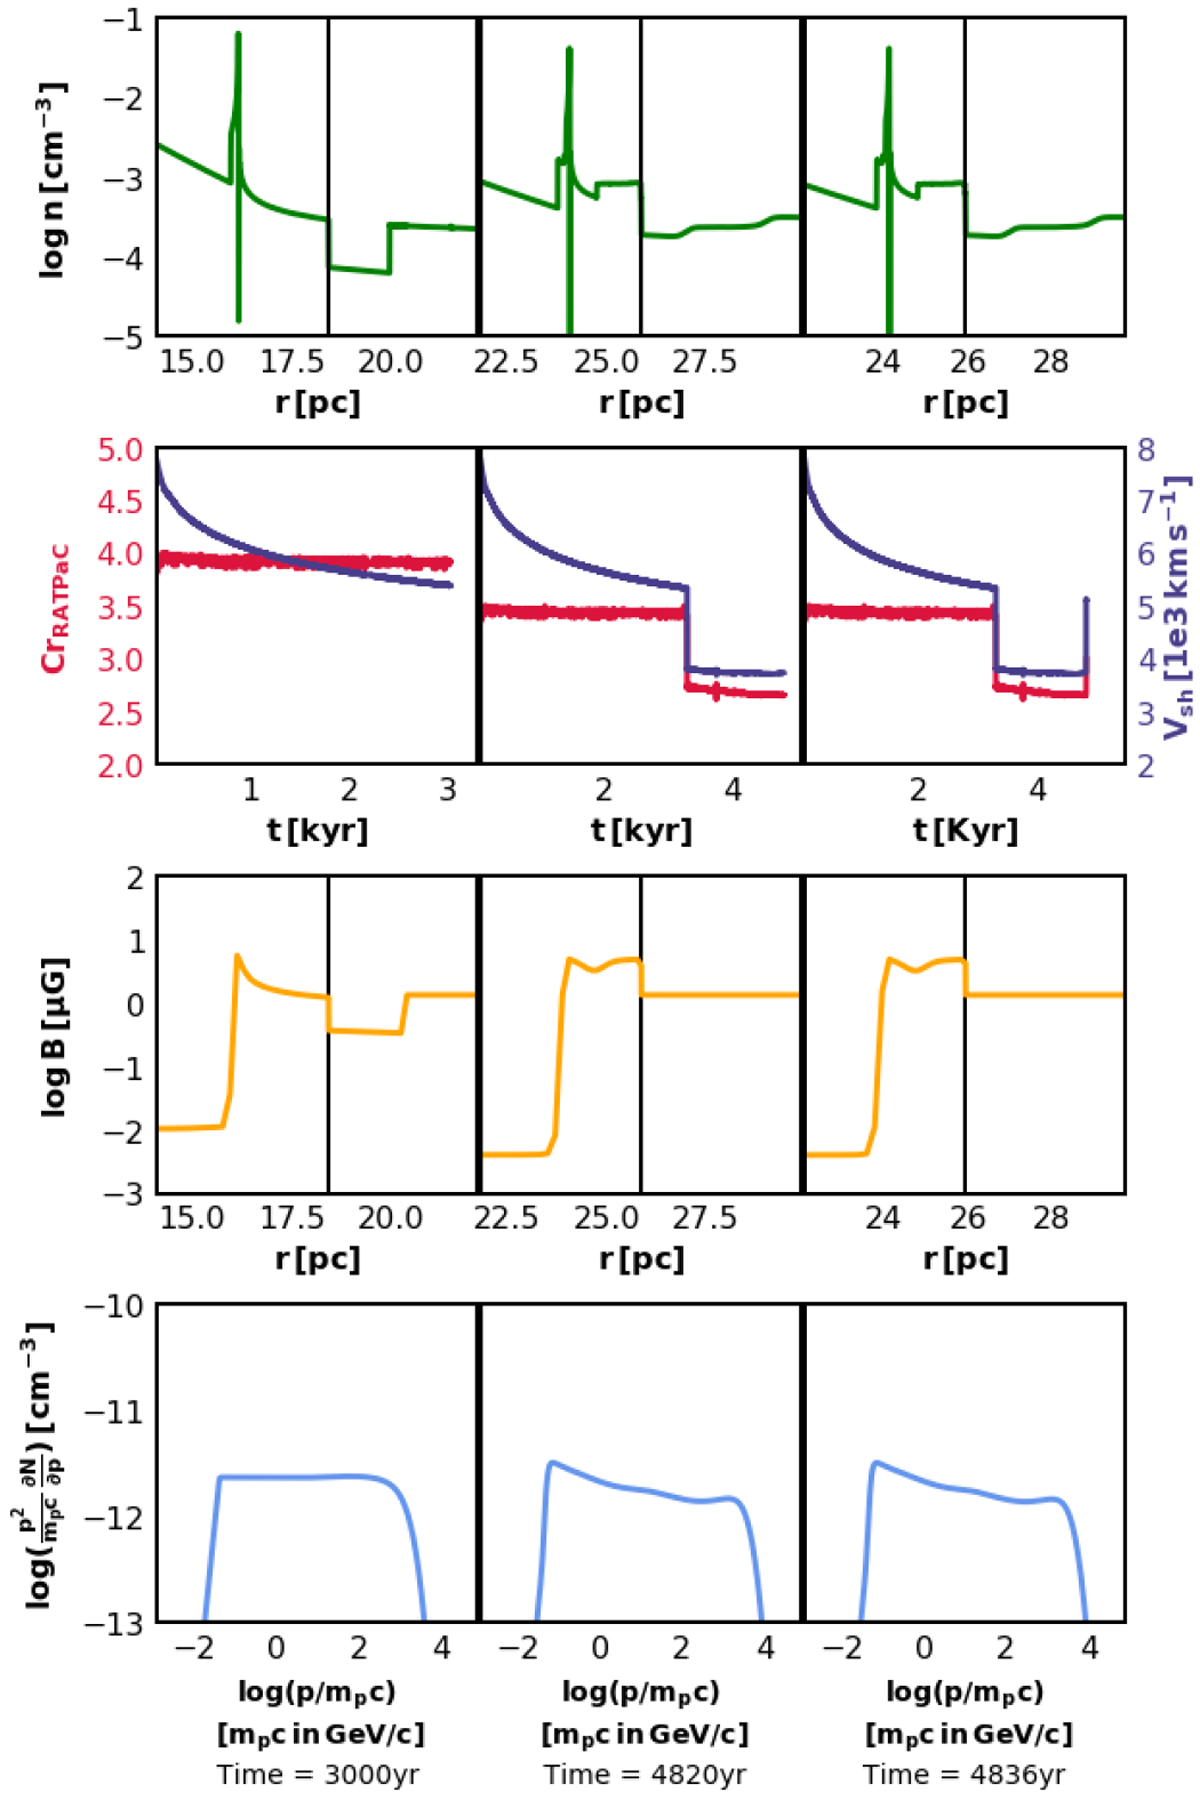
Fig. 3
Download original image
Proton spectra volume-averaged downstream of the FS at early times: for context, we also provide the gas number density, n, as a function of radius. The second row displays the compression ratio (CrRATPaC) and the shock speed (Vsh) up to the specific age, the third row depicts the magnetic-field profile (B), and the fourth row illustrates the proton spectra. The vertical lines in the first and the third row mark the FS position.
Current usage metrics show cumulative count of Article Views (full-text article views including HTML views, PDF and ePub downloads, according to the available data) and Abstracts Views on Vision4Press platform.
Data correspond to usage on the plateform after 2015. The current usage metrics is available 48-96 hours after online publication and is updated daily on week days.
Initial download of the metrics may take a while.