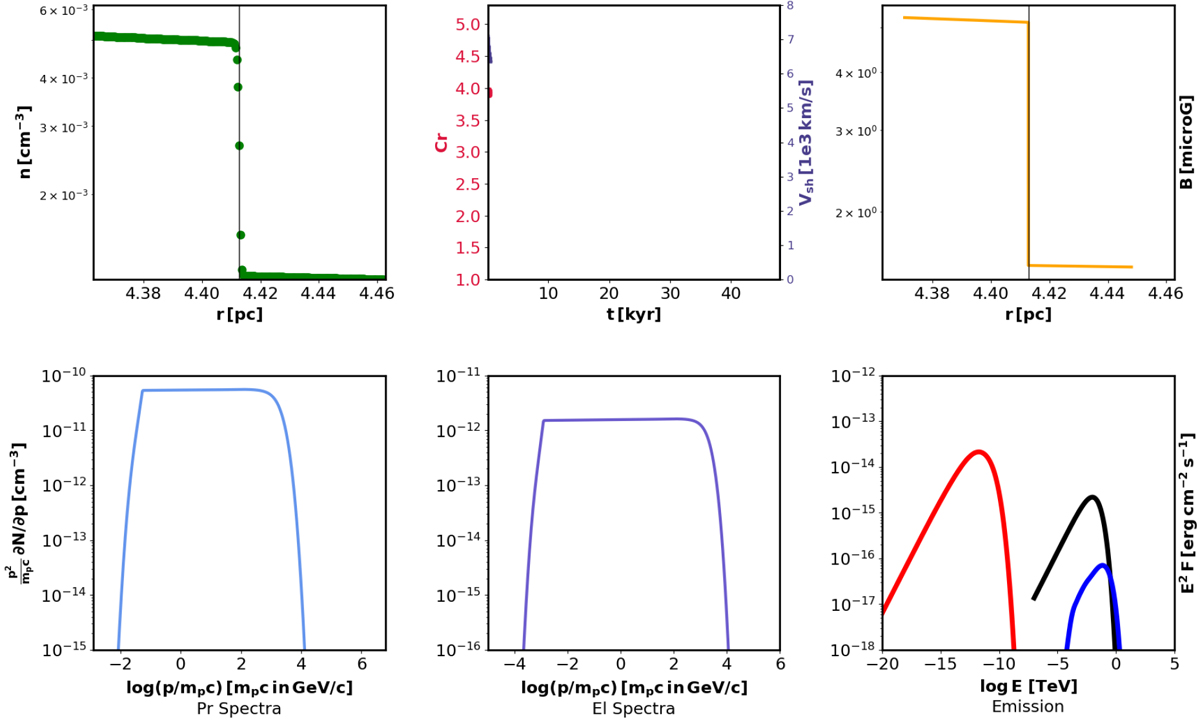
Fig. B.1
Download original image
Evolution of FS. (i) Upper row: The left panel illustrates the gas density, n, as a function of radius, the second panel shows the compression ratio, Cr, and the speed of the shock, Vsh, as functions of time, and the third panel depicts the magnetic-field strength near the shock, B. Theblack vertical line denotes the position of the SNR FS. (ii) Lower row: The first panel shows proton (Pr) spectra volume-averaged downstream of the FS. The corresponding electron (El) spectra are illustrated in the second panel. The third panel shows the spectra of synchrotron emission (red), IC emission (black) and PD emission (blue).
Current usage metrics show cumulative count of Article Views (full-text article views including HTML views, PDF and ePub downloads, according to the available data) and Abstracts Views on Vision4Press platform.
Data correspond to usage on the plateform after 2015. The current usage metrics is available 48-96 hours after online publication and is updated daily on week days.
Initial download of the metrics may take a while.