Fig. 5
Download original image
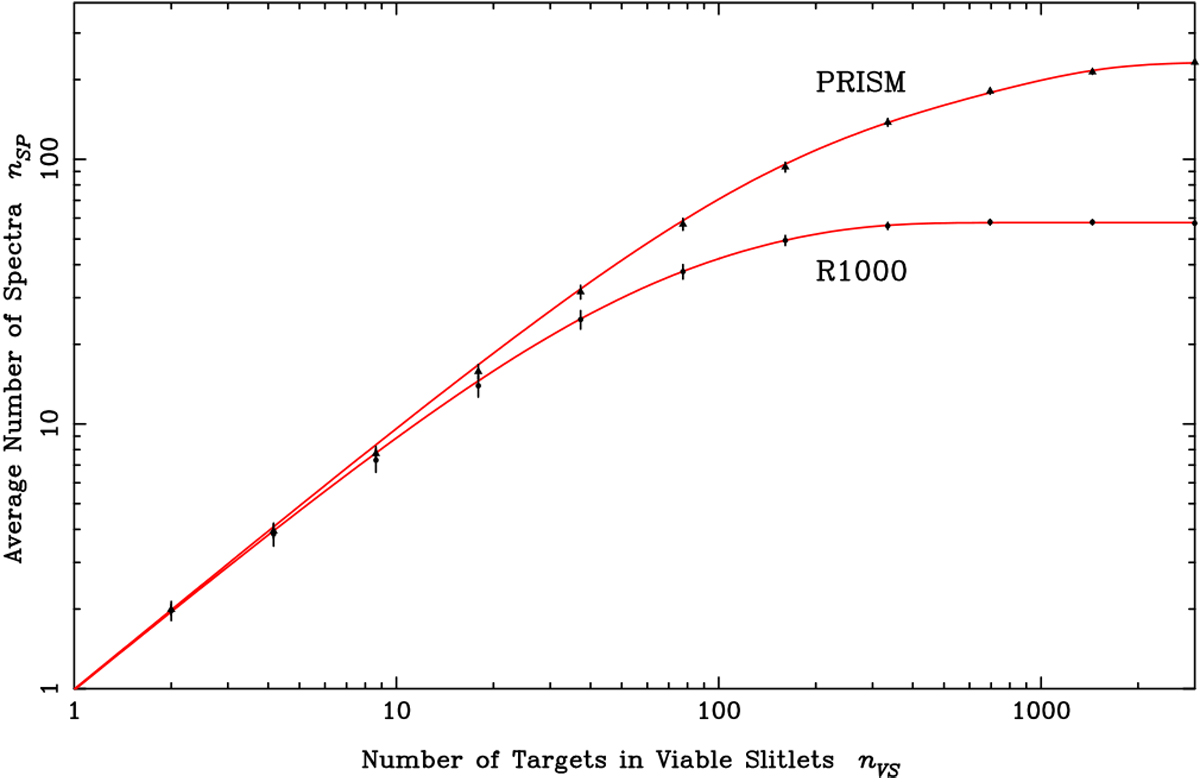
Average number of spectra ![]() that can be accommodated on the NIRSpec detector array in MOS mode without overlap as a function of nvs, the number of candidate targets located within Viable Slitlets on the MSA. The points show the results of 10 000 Monte Carlo trials carried out at the shown values of nvs for the PRISM and the G235M grating. The continuous curves show the fits to Eq. (5).
that can be accommodated on the NIRSpec detector array in MOS mode without overlap as a function of nvs, the number of candidate targets located within Viable Slitlets on the MSA. The points show the results of 10 000 Monte Carlo trials carried out at the shown values of nvs for the PRISM and the G235M grating. The continuous curves show the fits to Eq. (5).
Current usage metrics show cumulative count of Article Views (full-text article views including HTML views, PDF and ePub downloads, according to the available data) and Abstracts Views on Vision4Press platform.
Data correspond to usage on the plateform after 2015. The current usage metrics is available 48-96 hours after online publication and is updated daily on week days.
Initial download of the metrics may take a while.