Fig. 3
Download original image
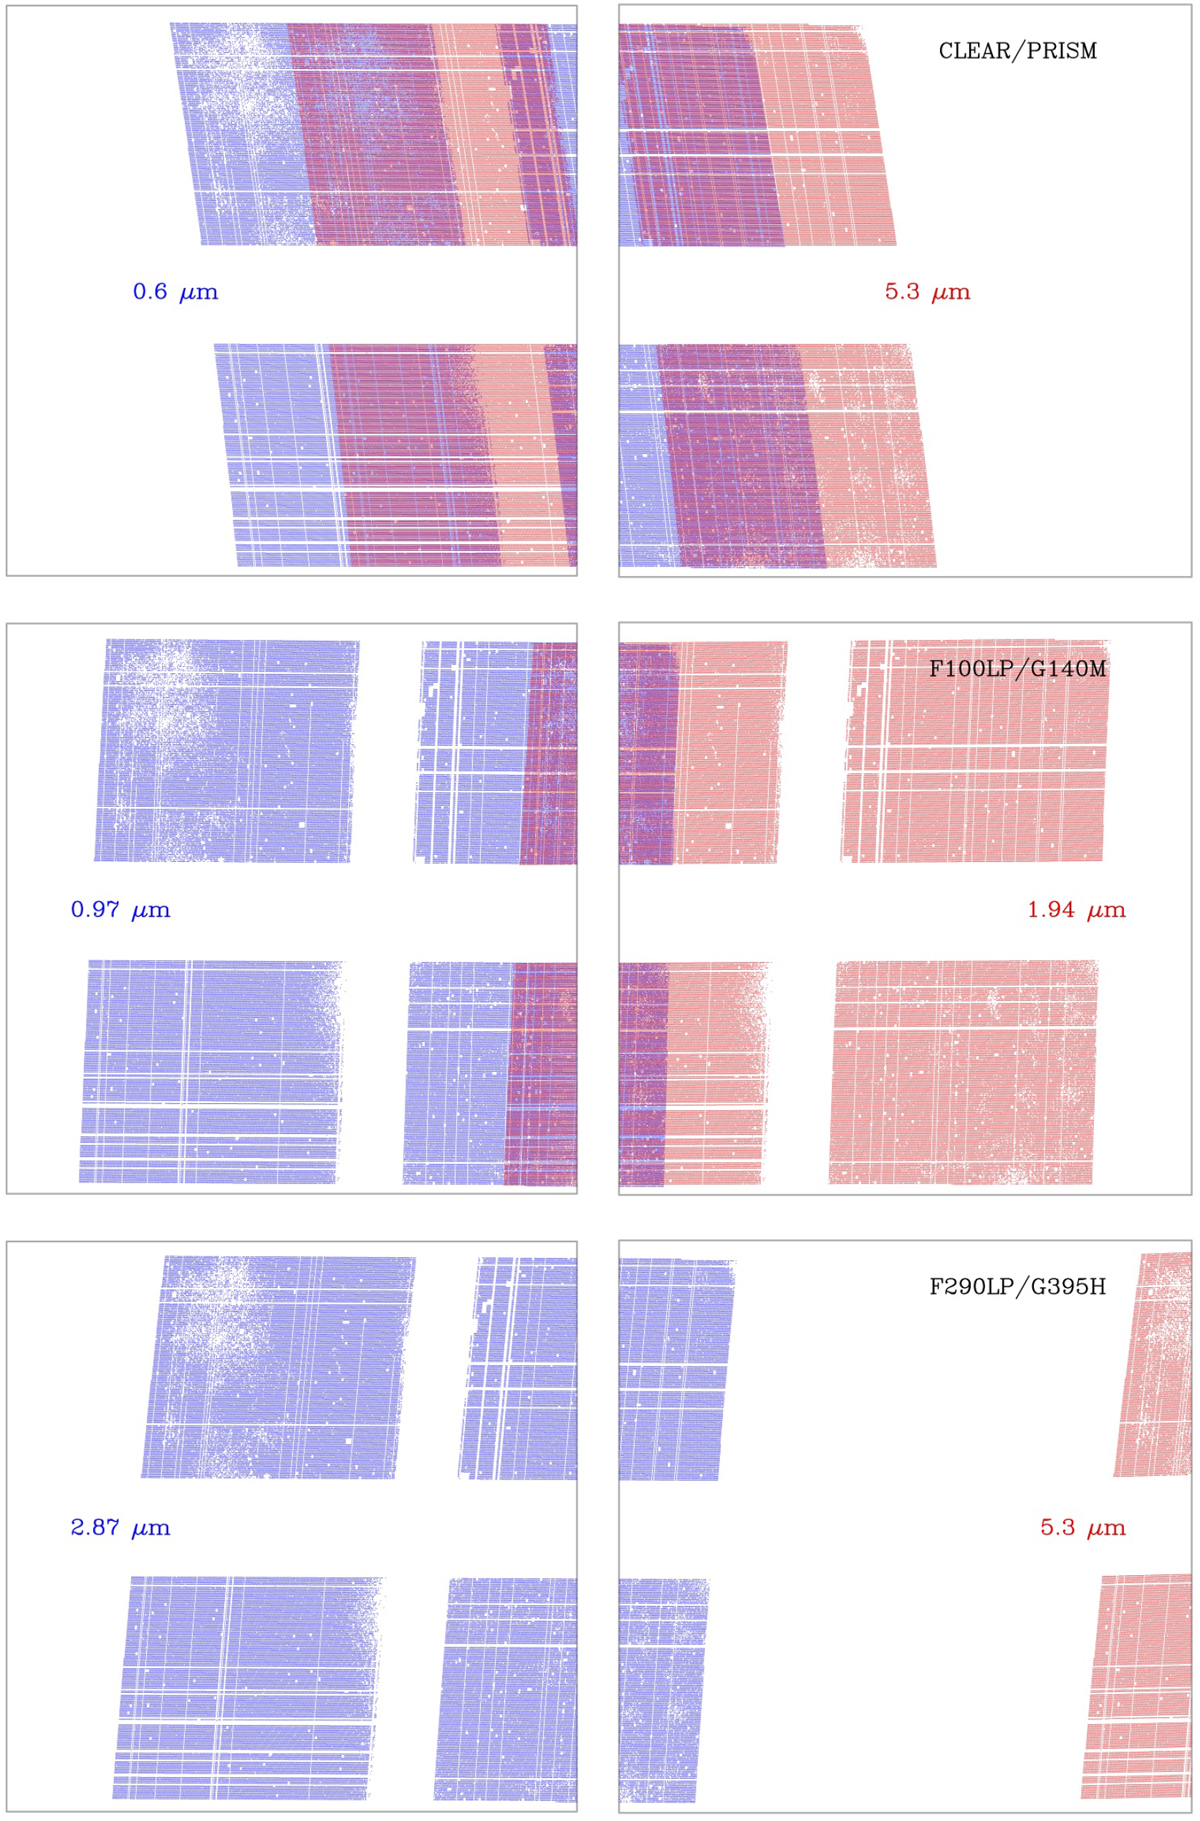
Monochromatic footprints of the functional shutters of the MSA, incident on the detector plane (the two outer squares), for the blue and red ends of the nominal wavelength range in three representative filter/disperser combinations (top down, respectively): CLEAR/PRISM (blue = 0.6 µm, red = 5.3 µm), F100LP/G140M (0.97 and 1.94 µm) and F290LP/G395H (2.87 and 5.3 µm). These plots demonstrate that when using the prism and medium resolution gratings (the example here is representative of all three R ≃ 1000 gratings), all the spectral traces connecting the two extreme monochromatic images fall within the outer bounds of the detectors. The plots also reveal the impact of the detector gap, as only spectra from shutters appearing in both colours on a single detector are uninterrupted by the gap (i.e. ~80% of shutters for the prism, but <10% for G140M). The F290LP/G395H plot also shows that for this, and indeed all high resolution gratings, only the left-most shutters will have the red end of their spectra falling on the detectors.
Current usage metrics show cumulative count of Article Views (full-text article views including HTML views, PDF and ePub downloads, according to the available data) and Abstracts Views on Vision4Press platform.
Data correspond to usage on the plateform after 2015. The current usage metrics is available 48-96 hours after online publication and is updated daily on week days.
Initial download of the metrics may take a while.