Fig. 14
Download original image
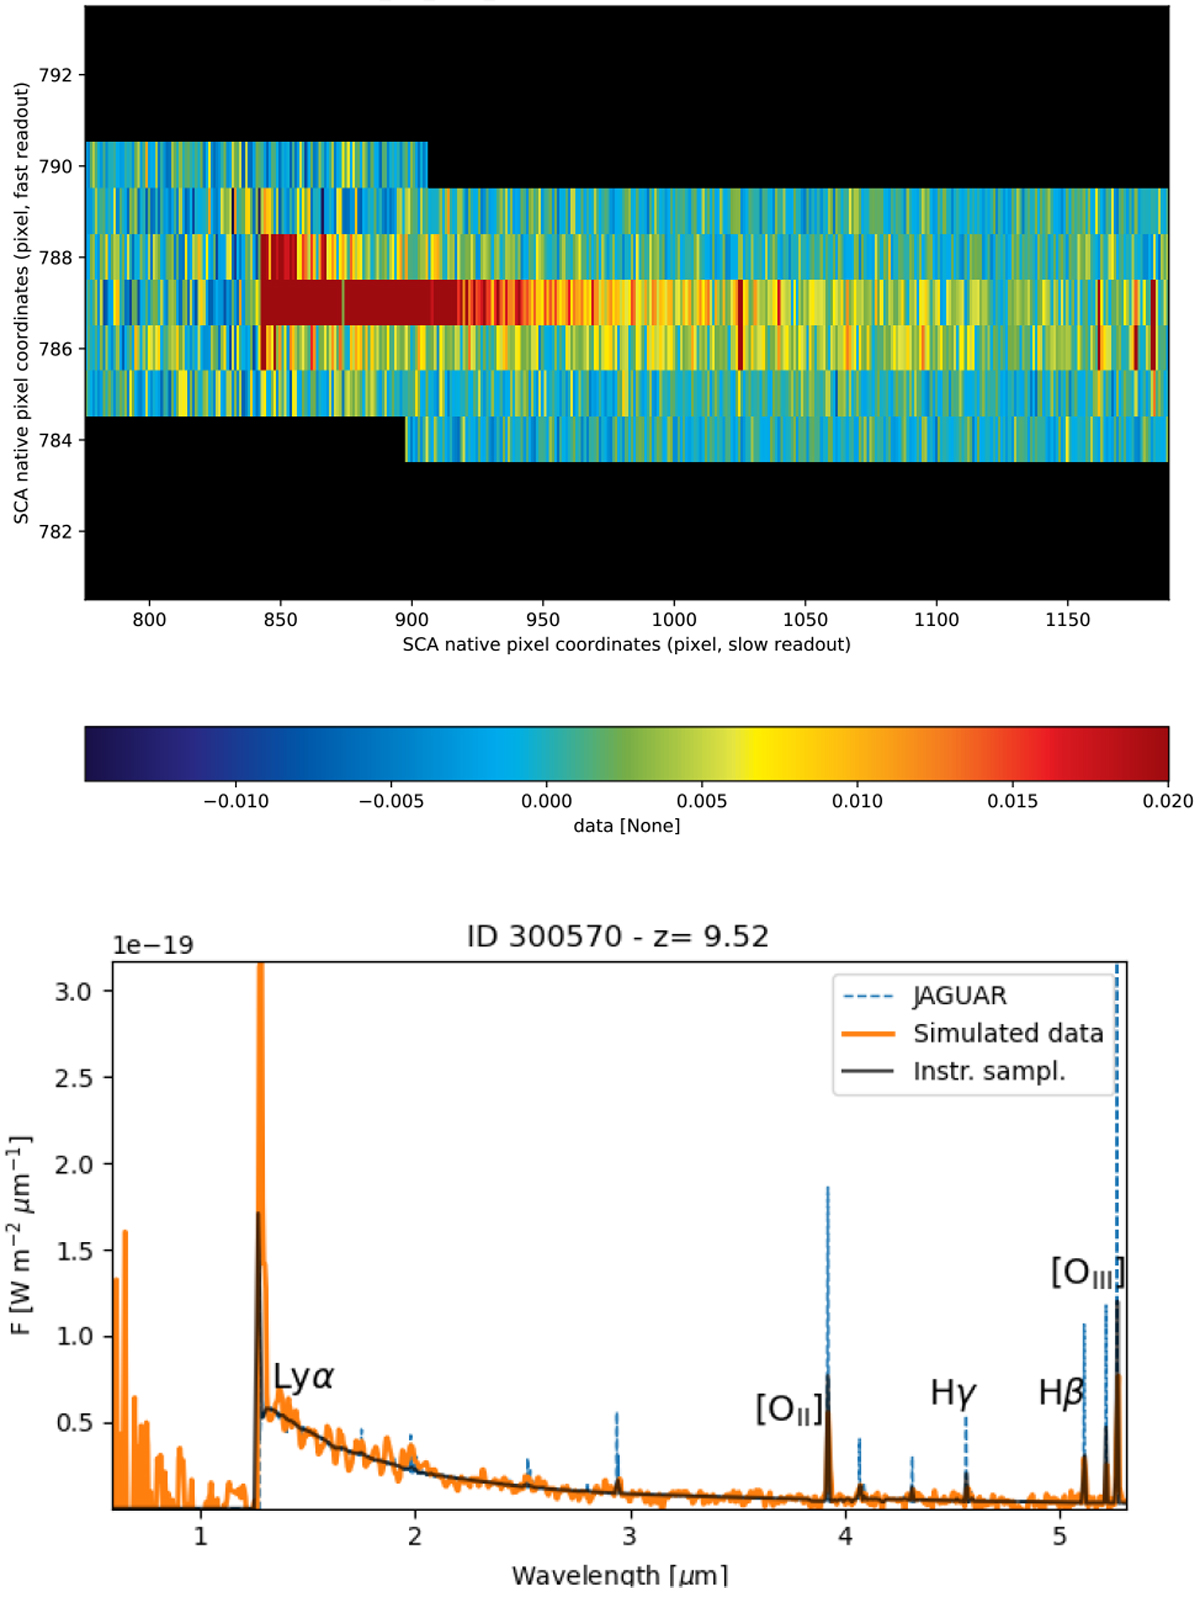
Example of a simulated NIRSpec MOS spectrum. Top panel: Sub-image containing the spectral trace extracted from one of the simulated count-rate images in PRISM mode of a mock galaxy at z = 9.52 having a mass of M = 2.9 × 10⁸ Mʘ, a UV luminosity of ~ 3.6 × 1028 erg s–1 and an AB magnitude of 27.6. Bottom panel: the matching final reduced 1D spectrum plotted in orange. The blue line shows the input spectrum from JAGUAR, and the grey line the profile expected from binning the input spectrum to the detector sampling.
Current usage metrics show cumulative count of Article Views (full-text article views including HTML views, PDF and ePub downloads, according to the available data) and Abstracts Views on Vision4Press platform.
Data correspond to usage on the plateform after 2015. The current usage metrics is available 48-96 hours after online publication and is updated daily on week days.
Initial download of the metrics may take a while.