Free Access
Fig. 13
Download original image
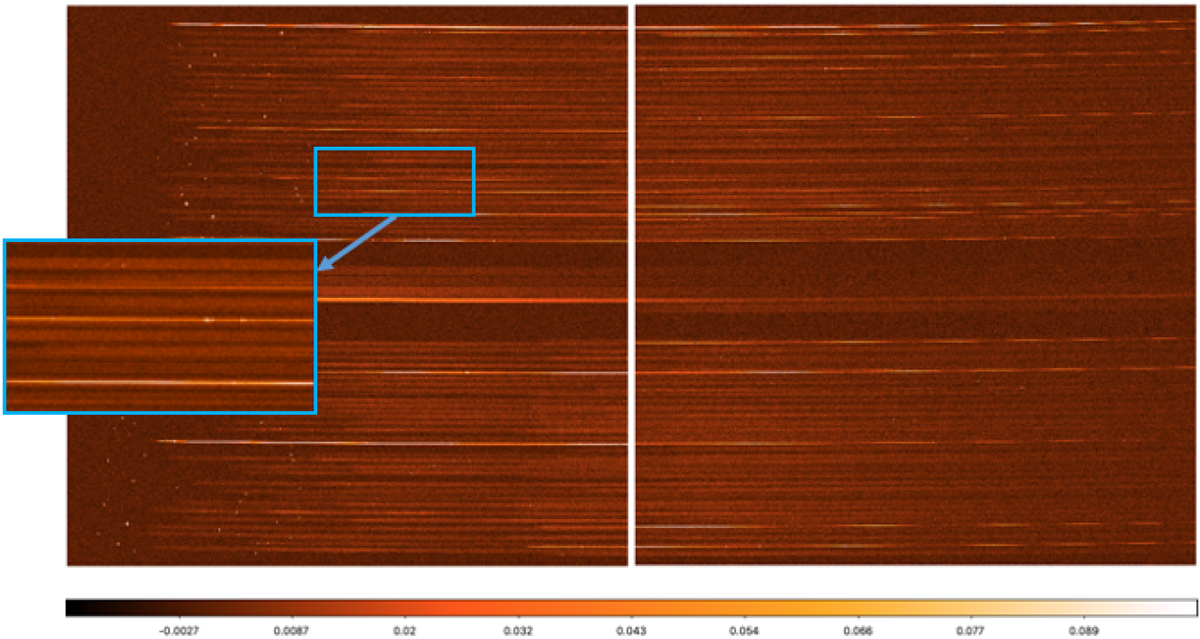
Simulated count-rate image for the G235M grating exposure matching the PRISM exposure of Fig. 12 and employing the same MSA configuration. The noise level corresponds to that of a single exposure of 2801s duration. One of the spectra at the middle of the inset shows examples of emission lines.
Current usage metrics show cumulative count of Article Views (full-text article views including HTML views, PDF and ePub downloads, according to the available data) and Abstracts Views on Vision4Press platform.
Data correspond to usage on the plateform after 2015. The current usage metrics is available 48-96 hours after online publication and is updated daily on week days.
Initial download of the metrics may take a while.