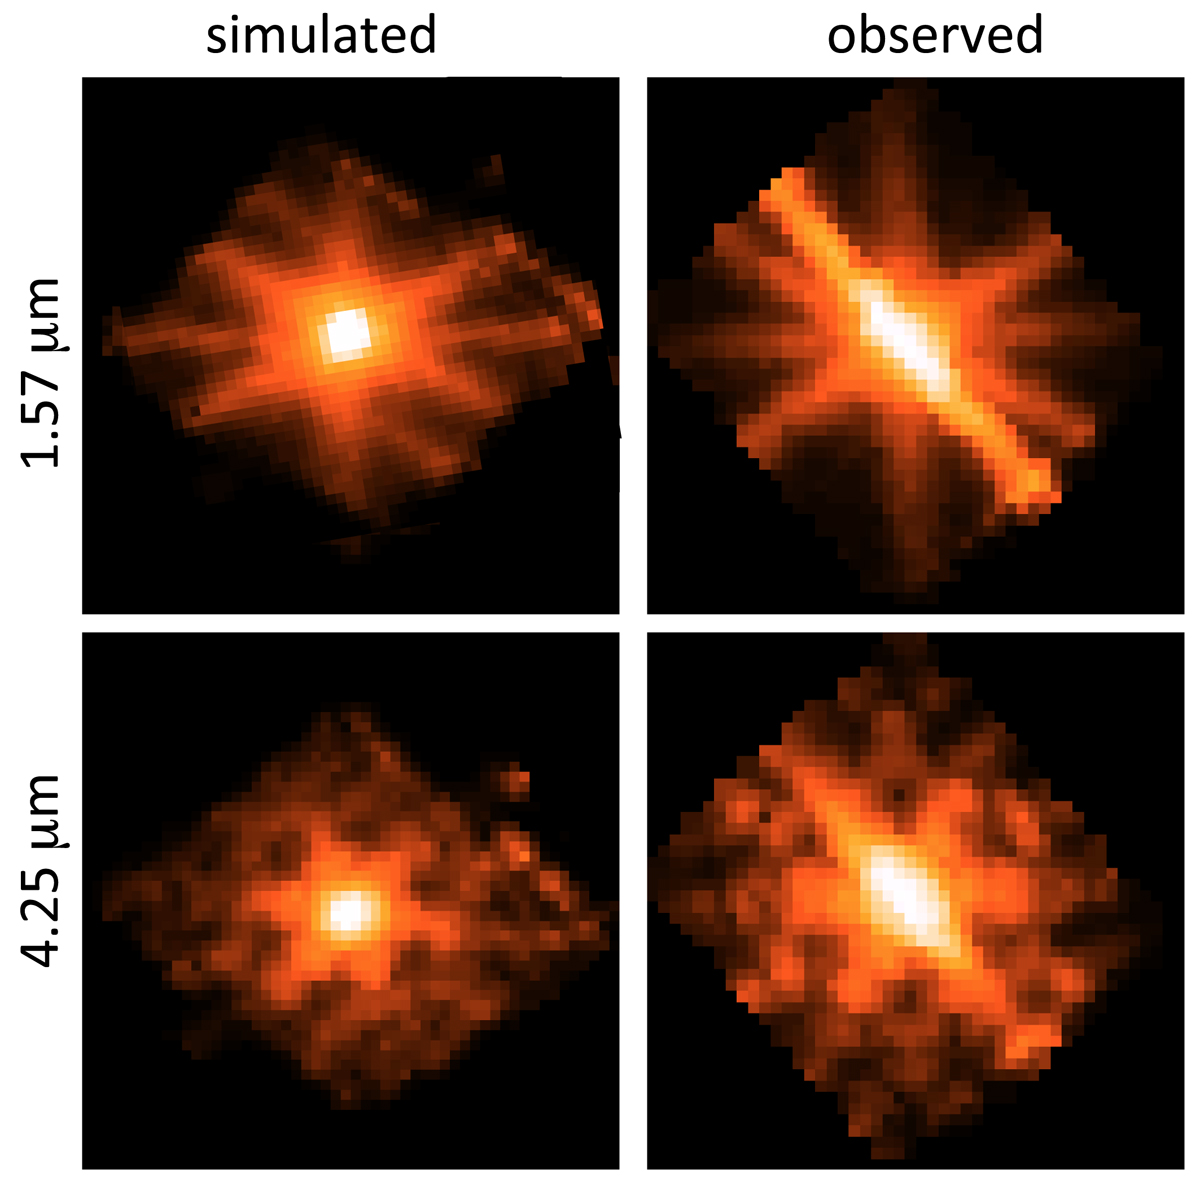
Fig. 7.
Download original image
Comparison of simulated (left) to observed (right) point source images in NIRSpec IFU data cubes, showing good agreement in the fainter structures of the diffraction pattern, both at short (top) and long (bottom) wavelengths. Quantitative evaluation of the core width is hampered by the bright diagonal “bar” in the observed data, which is an artifact caused by detector saturation.
Current usage metrics show cumulative count of Article Views (full-text article views including HTML views, PDF and ePub downloads, according to the available data) and Abstracts Views on Vision4Press platform.
Data correspond to usage on the plateform after 2015. The current usage metrics is available 48-96 hours after online publication and is updated daily on week days.
Initial download of the metrics may take a while.