Fig. 6.
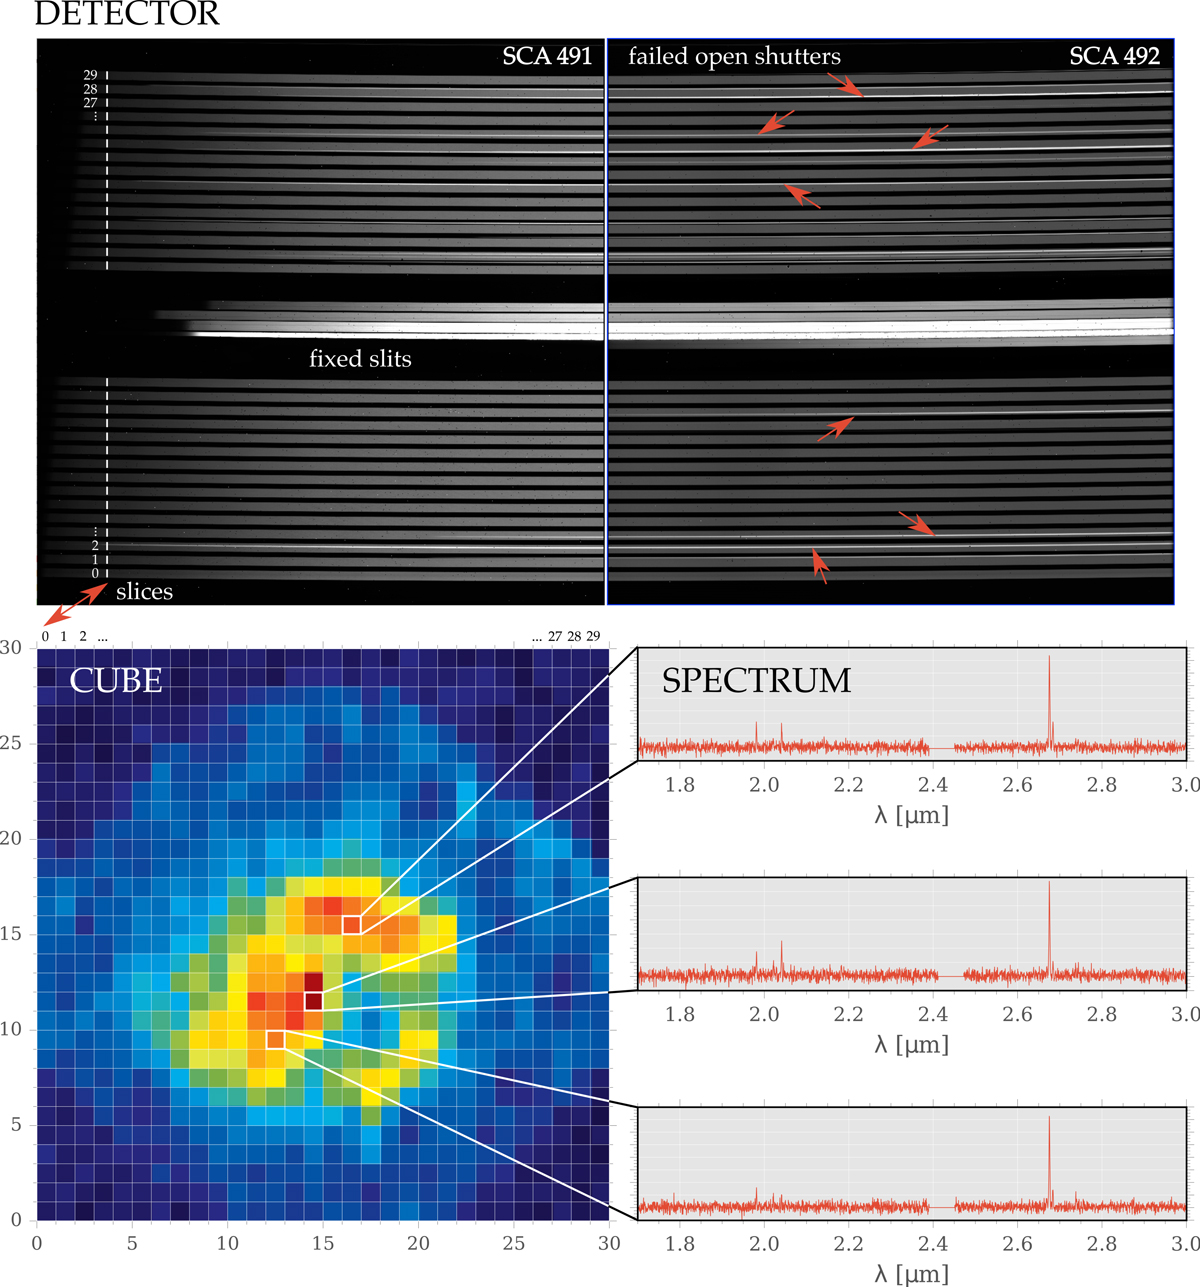
Download original image
Data products of the NIRSpec IFS mode. Top: example count rate map (obtained with internal lamp illumination during ground testing), showing the two NIRSpec detectors side-by-side. The numbering scheme of the 30 slices is indicated, as is the location of the ever-present fixed slit spectra. Also highlighted are a number of “contamination” spectra caused by failed-open MSA shutters. Bottom left: example “channel map” of a reconstructed data cube (created from simulated science data). The individual slices are identified by number as in the top panel. Bottom right: G235H spectra (extracted from the simulated data cube) for three arbitrary spaxels, illustrating the gap in wavelength coverage caused by the physical separation between the two detector arrays. We note that the exact gap position varies between slices, as described in Sect. 4.
Current usage metrics show cumulative count of Article Views (full-text article views including HTML views, PDF and ePub downloads, according to the available data) and Abstracts Views on Vision4Press platform.
Data correspond to usage on the plateform after 2015. The current usage metrics is available 48-96 hours after online publication and is updated daily on week days.
Initial download of the metrics may take a while.