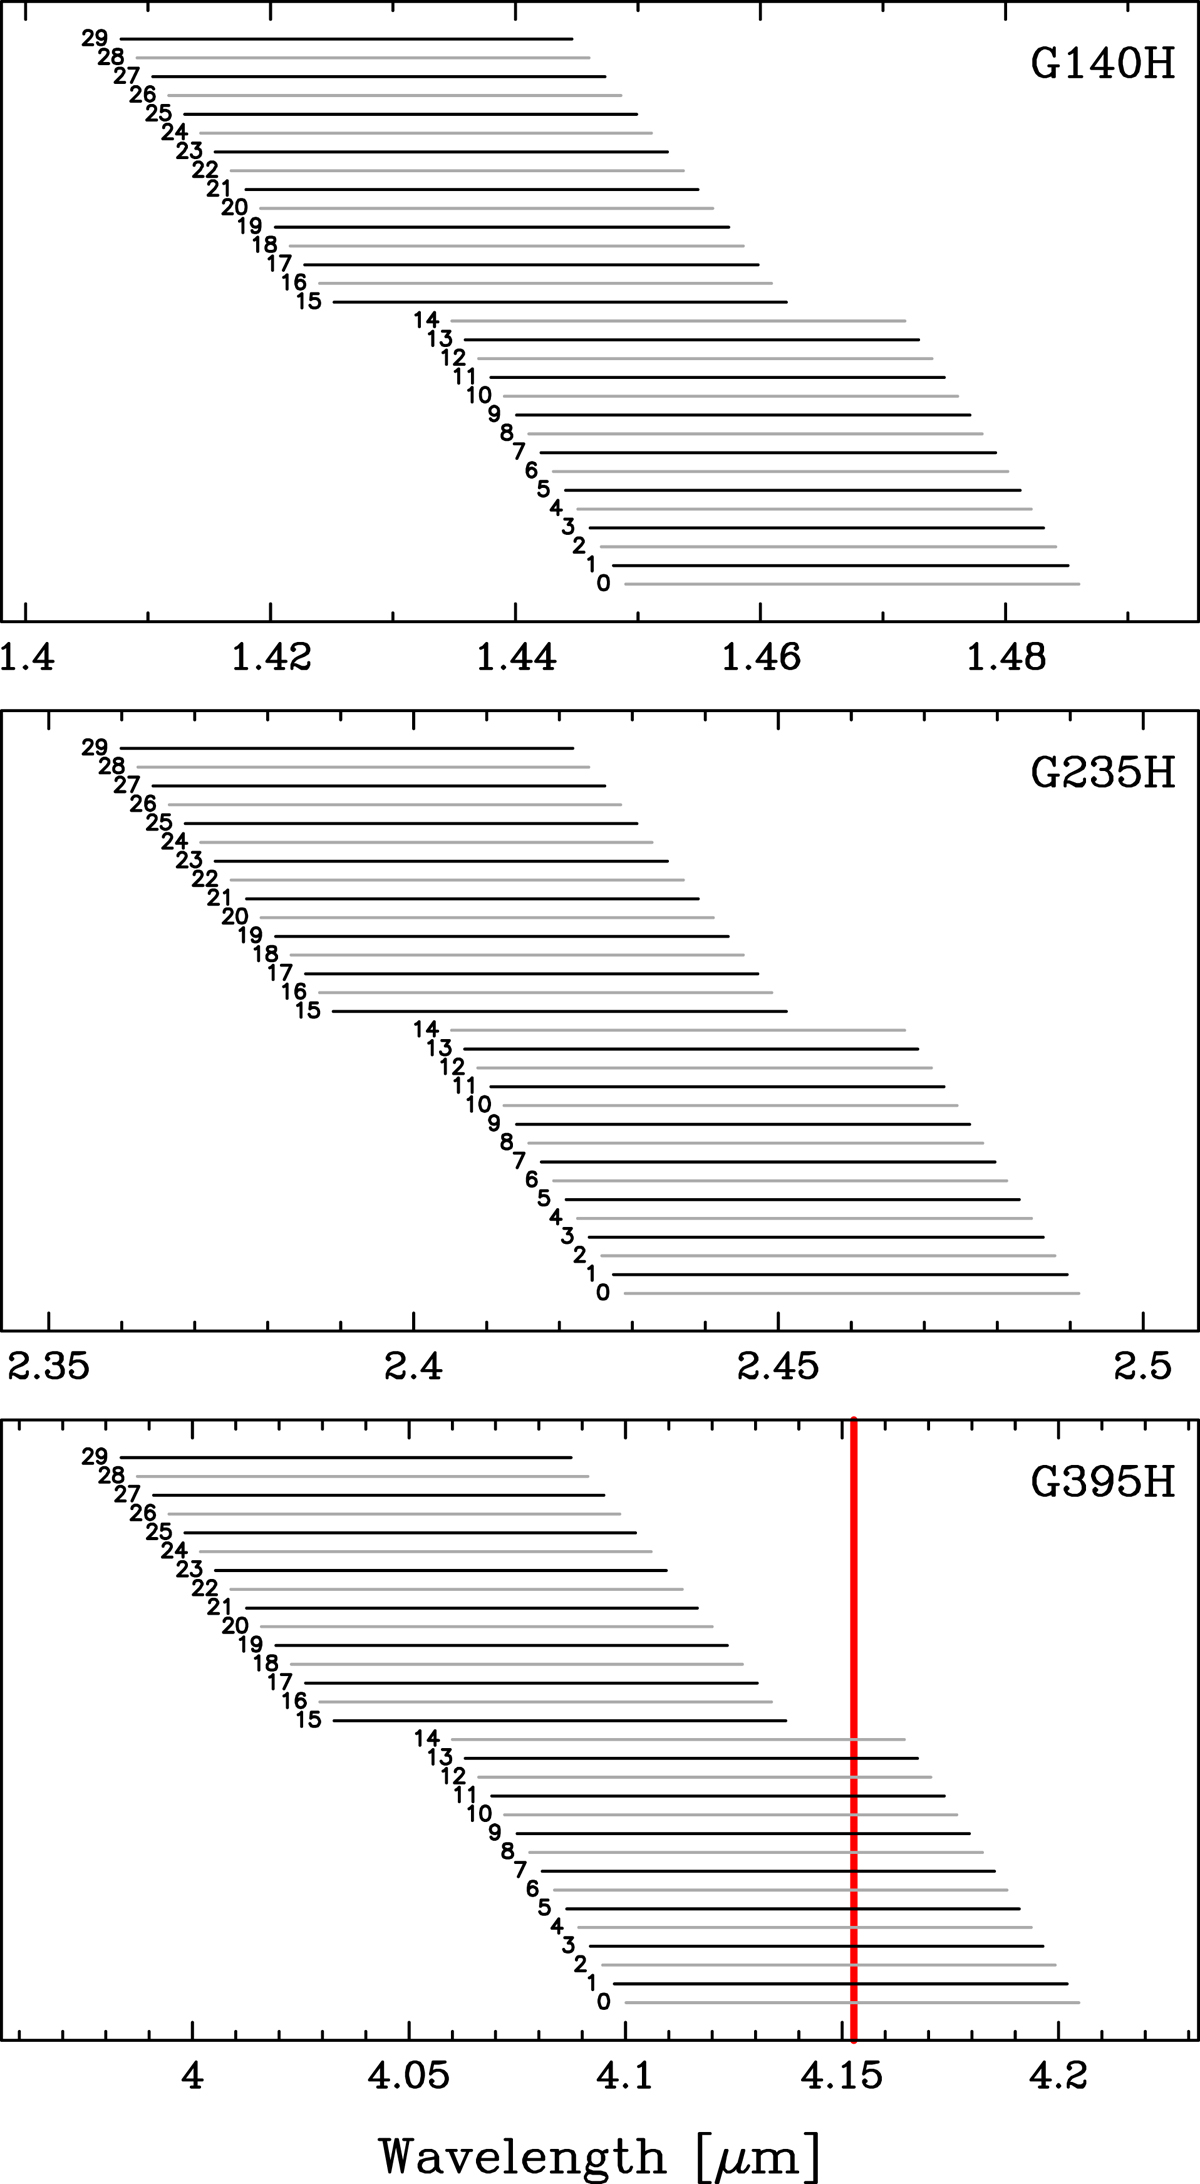
Fig. 14.
Download original image
Location of the NIRSpec detector gap for all IFU slices and affected gratings: G140H (top), G235H (middle), and G395H (bottom). For each slice of the IFU, the range of “missed” wavelengths is shown by a horizontal bar. The red vertical line in the bottom panel marks the position of the Hβ line for a target at z = 7.54. In this case, Hβ cannot be observed across half the field of view.
Current usage metrics show cumulative count of Article Views (full-text article views including HTML views, PDF and ePub downloads, according to the available data) and Abstracts Views on Vision4Press platform.
Data correspond to usage on the plateform after 2015. The current usage metrics is available 48-96 hours after online publication and is updated daily on week days.
Initial download of the metrics may take a while.