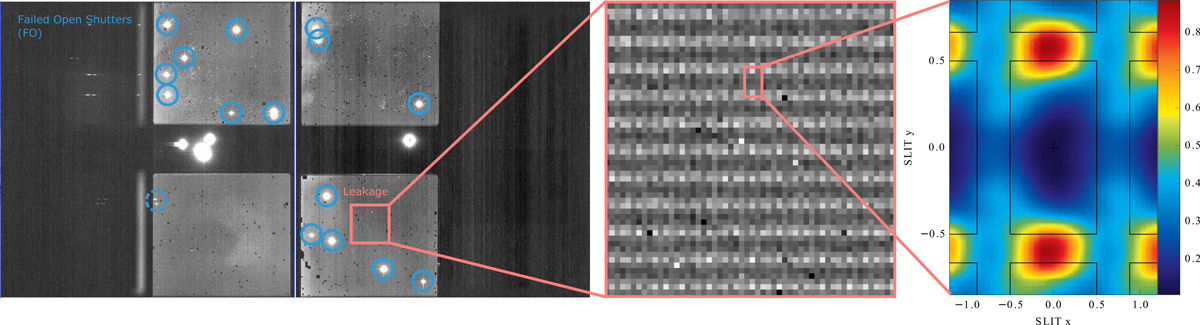
Fig. 12.
Download original image
Illustration of the low-level contamination leaking through the closed NIRSpec MSA, as measured from ground-based calibration data. Left: undispersed exposure through the closed MSA, clearly showing individual failed-open shutters (blue circles), as well as the low-level leakage across the MSA. Center: Enlarged subsection of the MSA showing the leakage pattern around individual shutters. Right: highly over-sampled image of the leakage pattern, obtained by superposition of the (re-binned) leakage signal from many individual shutters.
Current usage metrics show cumulative count of Article Views (full-text article views including HTML views, PDF and ePub downloads, according to the available data) and Abstracts Views on Vision4Press platform.
Data correspond to usage on the plateform after 2015. The current usage metrics is available 48-96 hours after online publication and is updated daily on week days.
Initial download of the metrics may take a while.