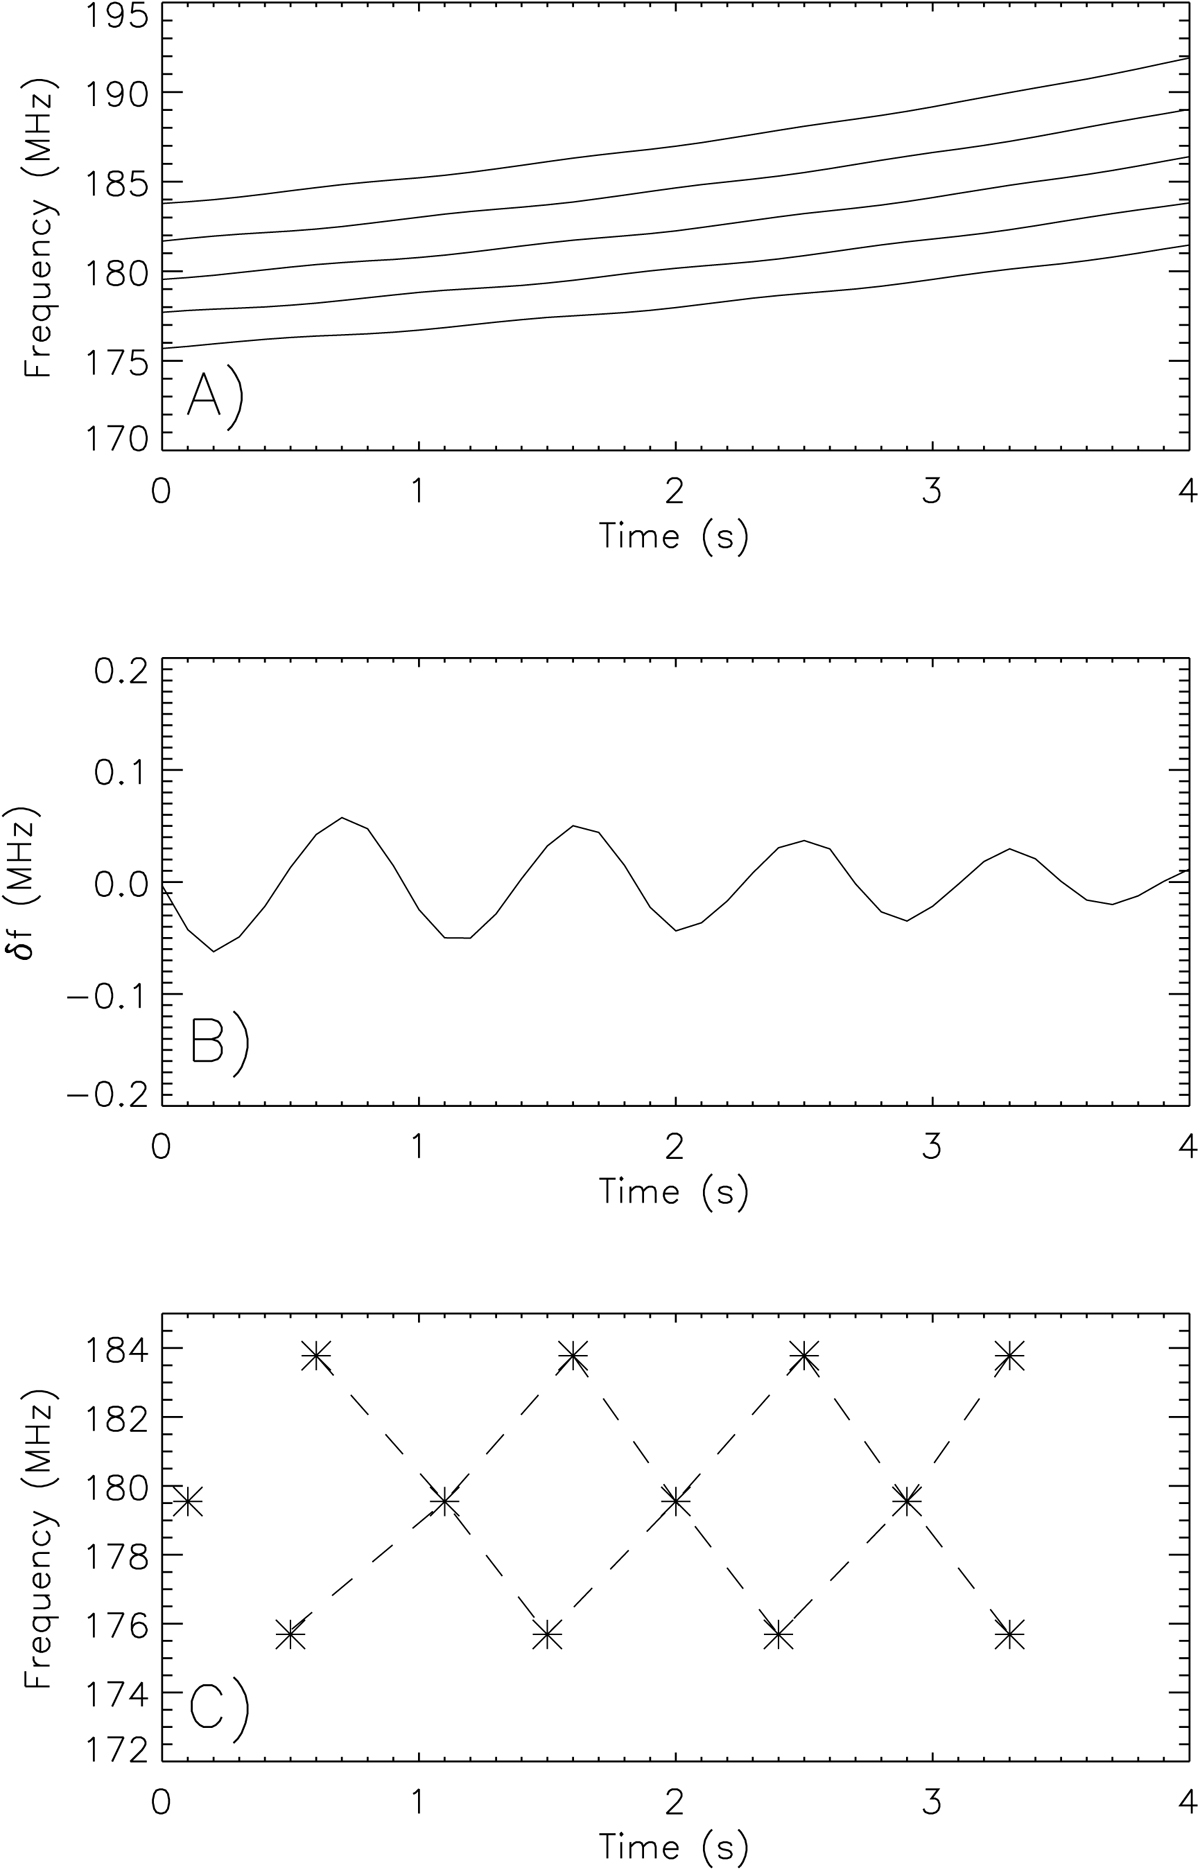
Fig. 11.
Download original image
Zebra case from 21 June 2011. (A) Zebra-stripe frequencies as in Fig. 9C, but with the δf variation caused by the magnetosonic wave (amplitude δn/n = δB/B = 0.0015, wavelength of 1370 km, and the velocity 214 km s−1). (B) δf. (C) Map of Δfn + 1 − Δfn, where Δfn = fn + 1 − fn, and fn is the frequency of the nth stripe numbered from the lowest frequency in the spectrum (part A). Asterisks mean maxima of these differences. Connecting dashed lines show the frequency drift.
Current usage metrics show cumulative count of Article Views (full-text article views including HTML views, PDF and ePub downloads, according to the available data) and Abstracts Views on Vision4Press platform.
Data correspond to usage on the plateform after 2015. The current usage metrics is available 48-96 hours after online publication and is updated daily on week days.
Initial download of the metrics may take a while.