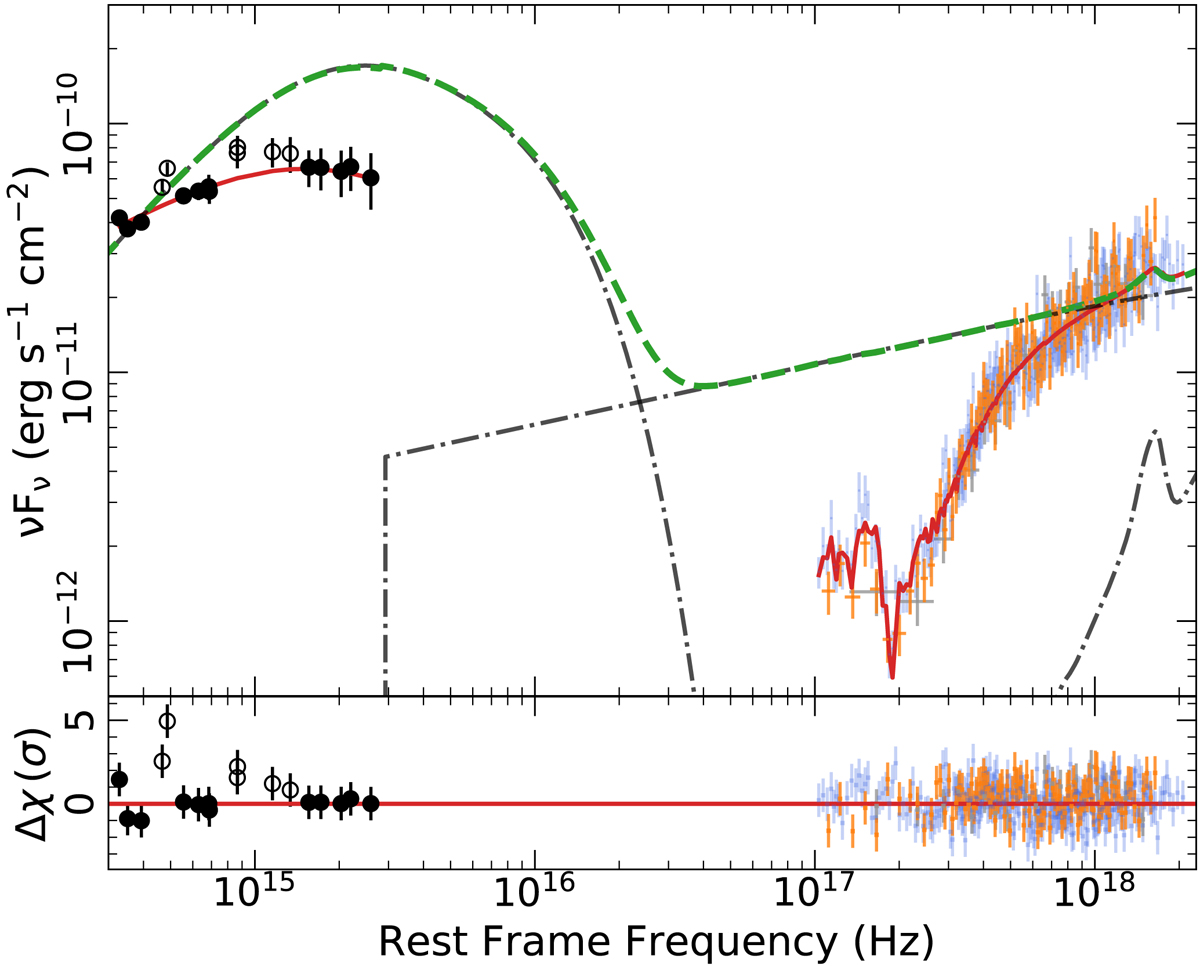
Fig. 4.
Download original image
Observed broadband NGC 5548 SED. The solid red line shows the model obtained for h = 46 rg. The dashed green line shows the unabsorbed best-fit model (i.e. by removing all Galactic and intrinsic neutral and warm absorbers). The dash-dotted black lines show the various spectral components. Empty circles indicate the data points that we did not consider during fitting, to avoid contamination from the BLR (see Sect. 4 for details). The grey, blue, and orange data points indicate the three X-ray spectra we used in the fitting.
Current usage metrics show cumulative count of Article Views (full-text article views including HTML views, PDF and ePub downloads, according to the available data) and Abstracts Views on Vision4Press platform.
Data correspond to usage on the plateform after 2015. The current usage metrics is available 48-96 hours after online publication and is updated daily on week days.
Initial download of the metrics may take a while.