| Issue |
A&A
Volume 661, May 2022
|
|
|---|---|---|
| Article Number | A89 | |
| Number of page(s) | 6 | |
| Section | Catalogs and data | |
| DOI | https://doi.org/10.1051/0004-6361/202142355 | |
| Published online | 05 May 2022 | |
Catalogue of stars measured in the Geneva seven-colour photometric system⋆
Department of Theoretical Physics and Astrophysics, Masaryk University, Kotlářská 2, 611 37 Brno, Czech Republic
e-mail: This email address is being protected from spambots. You need JavaScript enabled to view it.
Received:
2
October
2021
Accepted:
7
November
2021
Abstract
Context. The Geneva seven-colour photometric system is successfully applied to the study of various astrophysical objects. It measures the slope of the Paschen continuum, the Balmer discontinuity, and blocking absorption due to hydrogen or metallic lines. One of its greatest strengths is its intrinsic homogeneity.
Aims. A new catalogue of the available measurements was generated, 30 years after the last publication.
Methods. The identifications for the individual stars were cross-checked on the basis of the Gaia and 2MASS catalogues. The high precision coordinates together with proper motions (if available) are included, for the first time, in the catalogue. Special caution was exercised with binaries and high-proper-motion stars.
Results. The catalogue includes 42 911 entries of highly accurate photometry.
Conclusions. The data of this catalogue can be used for various applications, such as new calibrations of astrophysical parameters, the standardisation of new observations, and as additional information for ongoing and forthcoming all-sky surveys, such as the Transiting Exoplanet Survey Satellite.
Key words: astronomical databases: miscellaneous / catalogs / stars: general / techniques: photometric
The catalogue is available at the CDS via anonymous ftp to cdsarc.u-strasbg.fr (130.79.128.5) or via http://cdsarc.u-strasbg.fr/viz-bin/cat/J/A+A/661/A89
© ESO 2022
1. Introduction
Photometry of astrophysical objects in different well-defined filters has been a powerful tool since the introduction of photographic plates. With the invention of photomultipliers and charge-coupled devices, new eras in astrophysics were triggered. Depending on the object type, photometric measurements in different wavelength regions (not necessarily in the optical) can reveal significant characteristics with a low time investment. Unfortunately, the advantages of multi-filter usage are not used for satellite-based observations, such as the Kepler (Koch et al. 2010) and Transiting Exoplanet Survey Satellite (TESS; Ricker et al. 2015) missions.
The homogeneity of a photometric system is most important when it comes to deriving calibrations of astrophysical parameters and model atmospheres, as well as isochrones (Bessell 2005). A careful selection of standard stars and its replicability are essential for any standard system (Leggett et al. 2006; Cardiel et al. 2021). The Gaia consortium have taken a different approach to their photometric system. The definition of the three-filter photometry of the Data Release 2 (DR2; Evans et al. 2018) is different than that of the Early Data Release 3 (EDR3; Riello et al. 2021) and will be changed again in the Data Release 3, which is unfortunate.
In this paper, on the other hand, we present observations within one of the most homogeneous photometric system available, the Geneva seven-colour system (Golay 1980). Measurements were employed under the leadership of the Observatoire de Genève at six different observatories around the world. The filters were identical and the detectors well characterised. In addition, the reduction process is well defined and all the data are processed in a homogeneous way. The disadvantage of such a strategy is that the observed astrophysical objects are prescribed and limited.
The last published version of the Geneva seven-colour photometric catalogue dates back more than 30 years (Rufener 1989). Since then, regular updates have been made public via the General Catalogue of Photometric Data (GCPD; Mermilliod et al. 1997)1.
We present here the newest version (released September 2021), cross-matched with the recent Gaia data releases and the Two Micron All Sky Survey (2MASS) in order to clearly identify the unique identifications of the Geneva working group. This will allow, for the first time, the photometric data to be used in a much more convenient and broader context.
2. The Geneva seven-colour photometric system
We would like to give a short overview of the Geneva seven-colour photometric system. Detailed reviews can be found in Golay (1972, 1980), and Rufener & Nicolet (1988).
The system was defined in the late 1950s by Marcel Golay and first used at the Sphinx Observatory of the Jungfraujoch Scientific Station in 1960. It has subsequently been applied at the Observatoire de Haute Provence, the Gornergrat, Calar Alto, and La Silla observatories, and the IAC Observatory (Canary Islands).
The passbands (Fig. 1) were chosen with the intent of reproducing the general properties of the, at that time, newly developed and highly successful Johnson UBV system. Whereas the V filter is almost identical to the Johnson one, the U and B passbands are slightly adapted, presenting less overlap at the Balmer jump of the hydrogen spectrum. The other four intermediate filters, B1, B2, V1, and G, were added so that the stellar classification properties of spectrophotometry involving the hydrogen absorption lines and gradients defined over the Paschen continuum were well represented. Together they measure the wavelength region between 300 and 650 nm. The B1 and B2 filters each constitute a half part of the B filter, and likewise the V1 and G filters are each a half part of the V filter.
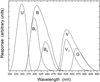 |
Fig. 1. Filter curves (taken from Rufener & Nicolet 1988) of the seven filters. |
Several indices were defined, which are also included in the catalogue. Those indices are briefly described here.
First we have U − B2, V1 − G, and B2 − V1, which are the colour indices that are well correlated to the Teff for different spectral types but are sensitive to the interstellar reddening. In addition, U − B2 and B2 − V1 are almost insensitive to metallicity (Golay 1980), whereas V1 − G can be used to trace chemically peculiar stars (Hauck & North 1982).
Next we have d and Δ. Both are very similar to the c1 index of the Strömgren–Crawford system (Strömgren 1966) and the Q parameter of the Johnson system (Gutierrez-Moreno 1975). The d index mainly measures the Balmer discontinuity and is insensitive to interstellar extinction (as are Δ, g, and m2). The loci of constant d are very similar to the loci of constant (U − B). The Δ index is sensitive to both chemical composition and gravity for cool-type stars.
We also have g and m2. These lines of constant values (isolines) are roughly parallel to the Teff axis for Teff > 11 000 K and are roughly parallel to the log g axis for Teff < 7000 K. Furthermore, both behave similarly to the m1 index of the Strömgren–Crawford system (Strömgren 1966), that is, they are sensitive to the metallicity, measuring the effect of line blocking in the region redder than 370 nm. The difference between these two indices is the definition of how they were made insensitive to interstellar reddening.
Finally, we have X, Y, and Z. These reddening-free indices were introduced for stars hotter than 8500 K through a rotation in the 3D space defined by the d, Δ, and g indices, such that X optimally correlates with Teff for B-type stars and Y correlates with log g for the same spectral type range (Cramer & Maeder 1979). However, soon it was discovered that they are able to distinguish between cool-type dwarfs and giants (Grenon 1978) as well as between normal and chemically peculiar stars of the upper main sequence through the Z index (Cramer & Maeder 1980), for example.
All types of ‘normal’ stars were investigated within the Geneva photometric system, from the most massive ones (Goy 1976; Cramer 1993) to the lower main sequence (Eggen 1977) and giants (Korotina et al. 1989). The success and capabilities are documented by the investigations of binaries (Barblan et al. 1998), Be stars (Burki 1999), chemically peculiar stars of the upper main sequence (Hauck & Curchod 1980; Hauck & North 1982), Population II objects (Hauck 1986), shell stars (Hauck 1987; Hauck & Jaschek 2000), variables of all types (Waelkens 1981; Lampens 1992; Bersier et al. 1994; Eyer & Aerts 2000), and weak-lined F-type stars (Hauck et al. 1991), just to mention a few of the main star groups.
Several calibrations of the Teff, log g, absolute magnitude, and metallicity for the Geneva photometric system are available (Kunzli et al. 1997; Cramer 1999; Paunzen et al. 2005, 2006; Netopil 2017).
One interesting concept developed on the basis of the highly accurate measurements are the ‘Geneva photometric boxes’ (Golay 1978; Creze et al. 1980; Nicolet 1987). With the availability of seven colours, a box around a so-called central star is defined as the set of stars that have similar colours or parameters in the vicinity of the central star. As a further step, theoretical colours from stellar model atmospheres can also be used as a substitute for the central star. Then one can test the idea that two stars with almost the same colours (parameters) have almost the same physical properties. Here we illustrate this idea with an example. We consider stars within the classical δ Scuti instability strip (Xiong et al. 2016) and their homogeneous photometric time series (Murphy et al. 2019). We would like to determine how many stars are pulsating with a given amplitude if we take one box in this region as well as what can be used to discriminate between a pulsating star and an apparently constant star. With the help of the presented catalogue, the new Gaia data, and additional available photometric, as well as spectroscopic measurements, such analyses can be done anew.
3. The catalogue
The current version of the catalogue as available in the GCPD includes 43 942 entries of standardised photometry. The last published one available in the SIMBAD Astronomical Database (II/169) consists of 29 397 data points. The first important task was to unambiguously identify the individual entries on the basis of modern all-sky surveys (i.e., list the right ascension and declination).
The unique numbering system of the GCPD, also used for the uvbyβ catalogue by Hauck & Mermilliod (1998), for example, poses several problems and is somewhat anachronistic. Its designation ‘GEN#’ (as included in SIMBAD) is followed by a plus or minus sign, an integer, a dot, and then eight digits. It is based on a hierarchical system of secondary catalogues and numbering systems (Rufener 1989). There are special codes for members of clusters, associations, different kinds of stars (for example, faint blue stars, white dwarfs, and emission-line stars), and common acronyms. To give just two examples, the high-proper-motion star Ross 413 (HIP 28940) is catalogued as ‘GEN# +9.80106025’, whereas the Wolf-Rayet star WR 66 (HIP 74634) is listed under ‘GEN# +6.10003891’. There are three main problems with this identification system. The first is that the last version of the catalogue, published in 1988, includes only very inaccurate coordinates in the Epoch 1900.0. Second, the secondary catalogues are sometimes not available, so no cross-match is possible. Finally, SIMBAD includes only a small fraction of the identifications, and sometimes they are incorrectly cross-matched.
To overcome these severe limitations, all objects were first cross-matched in the Gaia DR2 (Arenou et al. 2018) and EDR3 (Gaia Collaboration 2021). For this, we used the original identification and, if available, compared the Geneva V magnitude to the Gaia G one. For objects not found in the Gaia data sets, we used the 2MASS catalogue (Skrutskie et al. 2006) as an additional source.
In total, 42 911 entries could be unambiguously identified, all but 45 of which were in one the two Gaia data releases. For those we list the EDR3 (preferred) and DR2 identifications, the equatorial and Galactic coordinates, and the proper motions (if available). For the remaining 45 stars, the 2MASS identifiers and coordinates are listed. With this information, it is now possible to use the catalogue stars and cross-match them on the basis of precise coordinates.
There are many high-proper-motion stars from the compilations by Giclas et al. (1971) and Luyten (1979) included in the catalogue that deserve special attention. It seems that the EDR3 has quite a lot of duplicate entries for single objects. One example is G 270-159 (GEN# +9.80270159), for which the EDR3 lists two sources within 0 8: 2531243756196895104 (G = 10.89 mag) and 2531243756196895232 (14.70 mag). The total proper motions are 210.5 and 206.7 mas yr−1, respectively. A visual inspection in different wavelength regions shows that there is only one star of about 11th magnitude present. In such cases, the usage of the apparent magnitude allowed the duplicate entries to be sorted out. Nevertheless, the user is advised to check the entries in the Gaia catalogues when analysing high-proper-motion stars.
Stars that were found to be variable during the reduction process (Rufener & Bartholdi 1982) are marked with a ‘V’.
Another important point is the handling of binary systems. There are visual binary systems that normally have different entries – ‘A’ and ‘B’, for example – and spectroscopic binary systems with an entry ‘AB’. If possible, separated systems have been assigned the correct identification. A good example is the high-proper-motion visual binary 35 Psc (GEN# +1.00001061), which has three entries: GEN# +1.00001061 AV (and not GEN# +1.00001061A as listed in SIMBAD), GEN# +1.00001061 B, and GEN# +1.00001061 ABV. They were assigned to Gaia EDR3 2752338227234710784 (AV and ABV) Gaia EDR3 2752338227234710912 (B). In general, the users are advised to check the individual entries for known binary systems (second column in the catalogue).
The final catalogue includes 42 911 entries and is available in electronic form in the VizieR (CDS) database and the GCPD. It is organised as follows:
-
Column 1: Identification in the GCPD.
-
Column 2: Remarks on duplicity, variability, and so on.
-
Column 3: Geneva V magnitude.
-
Column 4: U − B.
-
Column 5: V − B.
-
Column 6: B1 − B.
-
Column 7: B2 − B.
-
Column 8: V1 − B.
-
Column 9: G − B.
-
Column 10: U − B1.
-
Column 11: U − B2.
-
Column 12: B1 − B2.
-
Column 13: V1 − G.
-
Column 14: B2 − G.
-
Column 15: B2 − V1.
-
Column 16: d = (U − B1)−1.430(B1 − B2).
-
Column 17: Δ = (U − B2)−0.832(B2 − G).
-
Column 18: g = (B1 − B2)−1.357(V1 − G).
-
Column 19: m2 = (B1 − B2)−0.457(B2 − V1).
-
Column 20: X = +0.3788 + 1.3764U − 1.2162B1 − 0.8498B2 − 0.1554V1 + 0.8450G.
-
Column 21: Y = −0.8288 + 0.3235U − 2.3228B1 + 2.3363B2 + 0.7495V1 − 1.0865G.
-
Column 22: Z = −0.4572 + 0.0255U − 0.1740B1 + 0.4696B2 − 1.1205V1 + 0.7994G.
-
Column 23: Weight of Geneva V magnitude.
-
Column 24: Standard deviation of Geneva V magnitude.
-
Column 25: Weight of the colours.
-
Column 26: Mean standard deviation for the colours.
-
Column 27: Gaia or 2MASS identification.
-
Column 28: Right ascension (J2000).
-
Column 29: Declination (J2000).
-
Column 30: Proper motion in right ascension direction.
-
Column 31: Standard error of proper motion in right ascension direction.
-
Column 32: Proper motion in declination direction.
-
Column 33: Standard error of proper motion in declination direction.
-
Column 34: Galactic longitude.
-
Column 35: Galactic latitude.
Because of the large number of columns, we do not give an example here.
4. Sample characteristics and conclusions
Figure 2 shows the distribution of the objects on the sky in equatorial and Galactic coordinates. The Galactic disk and several open clusters are immediately visible. There is also a high concentration of stars with Galactic latitudes < − 40° (i.e., in the direction of the South Galactic Pole). There is a significant number of high-proper-motion stars among these objects. With the Gaia data, these objects are interesting targets for a new analysis.
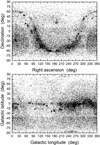 |
Fig. 2. Distribution of the catalogue stars in equatorial (upper panel) and Galactic (lower panel) coordinates. |
The distribution of the Geneva V magnitudes of all but seven catalogue entries is shown in Fig. 3. Of the stars listed in the catalogue, 98% are in the magnitude range of 4.0 < V < 13.0 mag, with a peak at about 8.5 mag. This is exactly the magnitude range in which the TESS satellite, for example, performs high precision photometric time series observations. The Geneva seven-colour photometry can serve as an excellent supplement to these observations for determining astrophysical parameters.
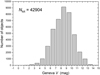 |
Fig. 3. Geneva V distribution of 42 904 catalogue entries. Seven do not have one. |
The high precision of the available photometric data is documented in Fig. 4. From the complete sample, about 92% of all measurements have a standard deviation below 0.01 mag, and 80% even have a standard deviation below 0.005 mag. This allows one to establish very accurate calibrations. Furthermore, the data can be used for fitting the spectral energy distribution (SED), for example within the VO SED Analyzer (VOSA) tool (Bayo et al. 2008).
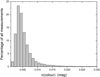 |
Fig. 4. Distribution of the mean standard deviation for the colours. About 92% of all measurements have a standard deviation below 0.01 mag. |
Finally, Fig. 5 shows the diagram of reddening-free X and Y indices as described in Sect. 2 for the complete sample. As guidance, the spectral types taken from Hauck et al. (1994) are also included. The broad main sequence band and the bifurcation of cool-type giants are clearly visible. The complete spectral range is very well represented. This diagram, together with several others as described in more detail in Golay (1980), allows one to establish detailed calibrations of astrophysical stellar parameters.
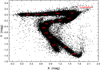 |
Fig. 5. X versus Y diagram of the catalogue stars. The spectral types (taken from Hauck et al. 1994) are listed for guidance. |
The data of this catalogue can be used for new calibrations of astrophysical parameters as well as for the standardisation of new observations. They can also be used as additional information for ongoing as well as forthcoming all-sky surveys.
Acknowledgments
This work has made use of data from the European Space Agency (ESA) mission Gaia (https://www.cosmos.esa.int/gaia), processed by the Gaia Data Processing and Analysis Consortium (DPAC, https://www.cosmos.esa.int/web/gaia/dpac/consortium). Funding for the DPAC has been provided by national institutions, in particular the institutions participating in the Gaia Multilateral Agreement. This research has made use of the SIMBAD database, operated at CDS, Strasbourg, France and of the WEBDA database, operated at the Department of Theoretical Physics and Astrophysics of the Masaryk University.
References
- Arenou, F., Luri, X., Babusiaux, C., et al. 2018, A&A, 616, A17 [NASA ADS] [CrossRef] [EDP Sciences] [Google Scholar]
- Barblan, F., Bartholdi, P., North, P., Burki, G., & Olson, E. C. 1998, A&AS, 132, 367 [NASA ADS] [CrossRef] [EDP Sciences] [Google Scholar]
- Bayo, A., Rodrigo, C., Barrado Y Navascués, D., et al. 2008, A&A, 492, 277 [NASA ADS] [CrossRef] [EDP Sciences] [Google Scholar]
- Bersier, D., Burki, G., & Burnet, M. 1994, A&AS, 108, 9 [NASA ADS] [Google Scholar]
- Bessell, M. S. 2005, ARA&A, 43, 293 [NASA ADS] [CrossRef] [Google Scholar]
- Burki, G. 1999, A&A, 346, 134 [NASA ADS] [Google Scholar]
- Cardiel, N., Zamorano, J., Bará, S., et al. 2021, MNRAS, 504, 3730 [NASA ADS] [CrossRef] [Google Scholar]
- Cramer, N. 1993, A&A, 269, 457 [NASA ADS] [Google Scholar]
- Cramer, N. 1999, New Astron. Rev., 43, 343 [CrossRef] [Google Scholar]
- Cramer, N., & Maeder, A. 1979, A&A, 78, 305 [NASA ADS] [Google Scholar]
- Cramer, N., & Maeder, A. 1980, A&A, 88, 135 [NASA ADS] [Google Scholar]
- Creze, M., Turon Lacarrieu, C., Golay, M., & Mandwewala, N. 1980, A&A, 85, 311 [NASA ADS] [Google Scholar]
- Eggen, O. J. 1977, PASP, 89, 706 [NASA ADS] [CrossRef] [Google Scholar]
- Evans, D. W., Riello, M., De Angeli, F., et al. 2018, A&A, 616, A4 [NASA ADS] [CrossRef] [EDP Sciences] [Google Scholar]
- Eyer, L., & Aerts, C. 2000, A&A, 361, 201 [NASA ADS] [Google Scholar]
- Gaia Collaboration (Brown, A. G. A., et al.) 2021, A&A, 649, A1 [NASA ADS] [CrossRef] [EDP Sciences] [Google Scholar]
- Giclas, H. L., Burnham, R., & Thomas, N. G. 1971, Lowell Proper Motion Survey Northern Hemisphere. The G Numbered Stars., 0”.26/year. [Google Scholar]
- Golay, M. 1972, Vistas in Astron., 14, 13 [NASA ADS] [CrossRef] [Google Scholar]
- Golay, M. 1978, A&A, 62, 189 [NASA ADS] [Google Scholar]
- Golay, M. 1980, Vistas Astron., 24, 141 [NASA ADS] [CrossRef] [Google Scholar]
- Goy, G. 1976, A&A, 48, 87 [NASA ADS] [Google Scholar]
- Grenon, M. 1978, Propriétés photométriques des étoiles G, K, M en relation avec la structure et l’évolution galactique [Google Scholar]
- Gutierrez-Moreno, A. 1975, PASP, 87, 805 [NASA ADS] [CrossRef] [Google Scholar]
- Hauck, B. 1986, in Spectroscopic and Photometric Classification of Population II Stars, eds. A. G. D. Upgren, & A. R. Philip, 53 [Google Scholar]
- Hauck, B. 1987, A&A, 177, 193 [NASA ADS] [Google Scholar]
- Hauck, B. 1994, in The MK Process at 50 Years: A Powerful Tool for Astrophysical Insight, eds. C. J. Corbally, R. O. Gray, & R. F. Garrison, ASP Conf. Ser., 60, 157 [NASA ADS] [Google Scholar]
- Hauck, B., & Curchod, A. 1980, A&A, 92, 289 [NASA ADS] [Google Scholar]
- Hauck, B., & Jaschek, C. 2000, A&A, 354, 157 [NASA ADS] [Google Scholar]
- Hauck, B., & Mermilliod, M. 1998, A&AS, 129, 431 [NASA ADS] [CrossRef] [EDP Sciences] [Google Scholar]
- Hauck, B., & North, P. 1982, A&A, 114, 23 [NASA ADS] [Google Scholar]
- Hauck, B., Jaschek, C., Jaschek, M., & Andrillat, Y. 1991, A&A, 252, 260 [NASA ADS] [Google Scholar]
- Koch, D. G., Borucki, W. J., Basri, G., et al. 2010, ApJ, 713, L79 [Google Scholar]
- Korotina, L. V., Dragunova, A. V., & Komarov, N. S. 1989, Astrophysics, 31, 735 [NASA ADS] [CrossRef] [Google Scholar]
- Kunzli, M., North, P., Kurucz, R. L., & Nicolet, B. 1997, A&AS, 122, 51 [NASA ADS] [CrossRef] [EDP Sciences] [Google Scholar]
- Lampens, P. 1992, A&AS, 95, 471 [NASA ADS] [Google Scholar]
- Leggett, S. K., Currie, M. J., Varricatt, W. P., et al. 2006, MNRAS, 373, 781 [NASA ADS] [CrossRef] [Google Scholar]
- Luyten, W. J. 1979, LHS catalogue. A catalogue of stars with proper motions Exceeding 0”5 Annually, 2nd edn. (Minneapolis: University of Minnesota) [Google Scholar]
- Mermilliod, J. C., Mermilliod, M., & Hauck, B. 1997, A&AS, 124, 349 [NASA ADS] [CrossRef] [EDP Sciences] [Google Scholar]
- Murphy, S. J., Hey, D., Van Reeth, T., & Bedding, T. R. 2019, MNRAS, 485, 2380 [NASA ADS] [CrossRef] [Google Scholar]
- Netopil, M. 2017, MNRAS, 469, 3042 [NASA ADS] [CrossRef] [Google Scholar]
- Nicolet, B. 1987, A&A, 177, 233 [NASA ADS] [Google Scholar]
- Paunzen, E., Schnell, A., & Maitzen, H. M. 2005, A&A, 444, 941 [NASA ADS] [CrossRef] [EDP Sciences] [Google Scholar]
- Paunzen, E., Schnell, A., & Maitzen, H. M. 2006, A&A, 458, 293 [NASA ADS] [CrossRef] [EDP Sciences] [Google Scholar]
- Ricker, G. R., Winn, J. N., Vanderspek, R., et al. 2015, J. Astron. Telesc. Instrum. Syst., 1 [Google Scholar]
- Riello, M., De Angeli, F., Evans, D. W., et al. 2021, A&A, 649, A3 [NASA ADS] [CrossRef] [EDP Sciences] [Google Scholar]
- Rufener, F. 1989, A&AS, 78, 469 [NASA ADS] [Google Scholar]
- Rufener, F., & Bartholdi, P. 1982, A&AS, 48, 503 [NASA ADS] [Google Scholar]
- Rufener, F., & Nicolet, B. 1988, A&A, 206, 357 [NASA ADS] [Google Scholar]
- Skrutskie, M. F., Cutri, R. M., Stiening, R., et al. 2006, AJ, 131, 1163 [NASA ADS] [CrossRef] [Google Scholar]
- Strömgren, B. 1966, ARA&A, 4, 433 [CrossRef] [Google Scholar]
- Waelkens, C. 1981, A&A, 97, 274 [NASA ADS] [Google Scholar]
- Xiong, D. R., Deng, L., Zhang, C., & Wang, K. 2016, MNRAS, 457, 3163 [Google Scholar]
All Figures
|
Fig. 1. Filter curves (taken from Rufener & Nicolet 1988) of the seven filters. |
| In the text | |
|
Fig. 2. Distribution of the catalogue stars in equatorial (upper panel) and Galactic (lower panel) coordinates. |
| In the text | |
|
Fig. 3. Geneva V distribution of 42 904 catalogue entries. Seven do not have one. |
| In the text | |
|
Fig. 4. Distribution of the mean standard deviation for the colours. About 92% of all measurements have a standard deviation below 0.01 mag. |
| In the text | |
|
Fig. 5. X versus Y diagram of the catalogue stars. The spectral types (taken from Hauck et al. 1994) are listed for guidance. |
| In the text | |
Current usage metrics show cumulative count of Article Views (full-text article views including HTML views, PDF and ePub downloads, according to the available data) and Abstracts Views on Vision4Press platform.
Data correspond to usage on the plateform after 2015. The current usage metrics is available 48-96 hours after online publication and is updated daily on week days.
Initial download of the metrics may take a while.