Fig. 7
Download original image
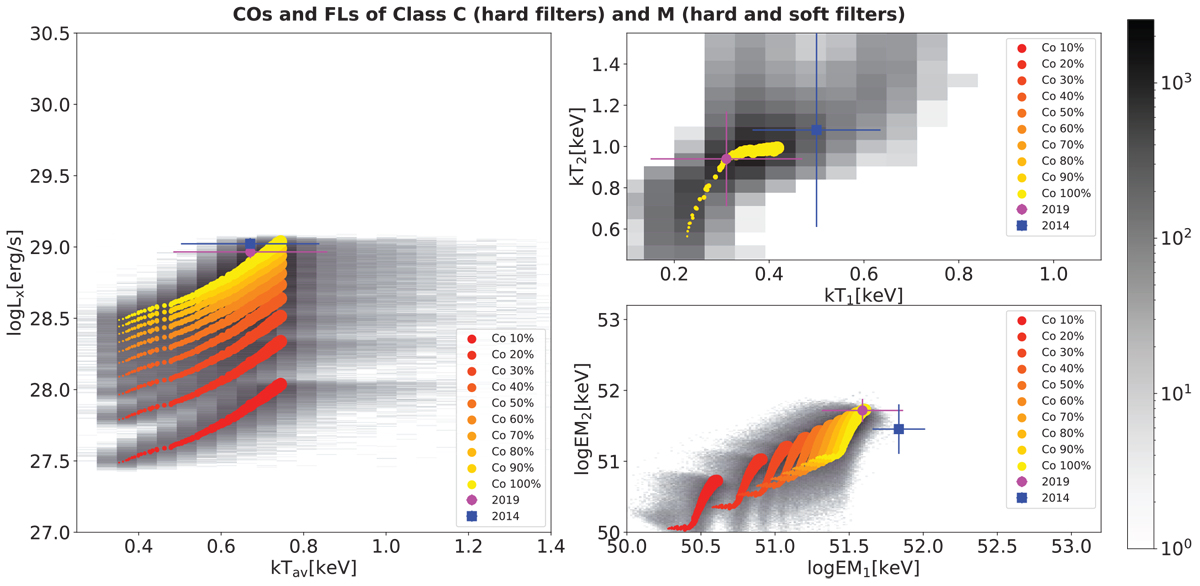
X-ray luminosity as a function of emission-measure-weighted thermal energy kТav (left panel) and the two temperatures and emission measures (right panel). The EMDs used for generating these grids are composed of time-averaged COs covering from 10 to 100% of the total corona and FLs of Class С and Class M, time-averaged over their evolution and varying from 0 to 15% of the area of the COs. The Class M flares were also observed with Yohkoh with a pair of soft filters in addition to the pair of hard filters (used for the analysis of the Class С flare). The coding of the plots follows Fig. 3.
Current usage metrics show cumulative count of Article Views (full-text article views including HTML views, PDF and ePub downloads, according to the available data) and Abstracts Views on Vision4Press platform.
Data correspond to usage on the plateform after 2015. The current usage metrics is available 48-96 hours after online publication and is updated daily on week days.
Initial download of the metrics may take a while.