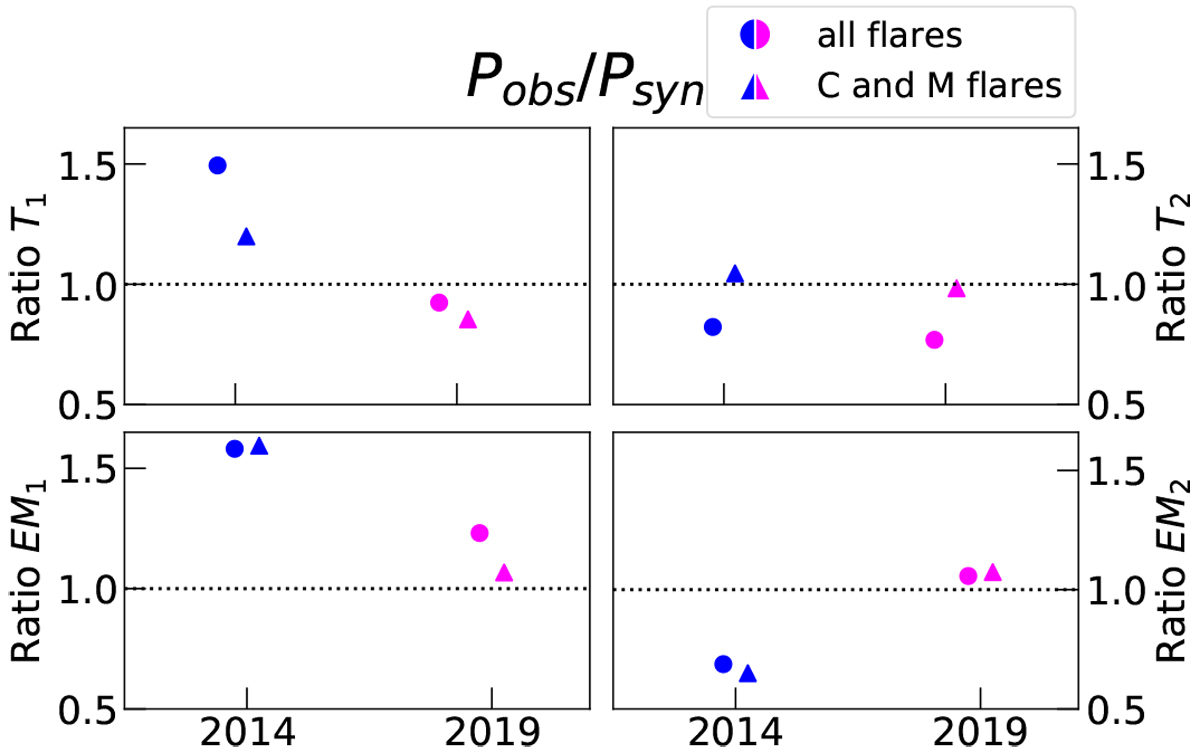
Fig. 6
Download original image
Ratios between the best-fitting parameters of the spectra of Kepler-63 and the kT and EM values of the best-matching synthetic spectra4. The blue symbols are the ratios obtained from the comparison with the observation of 2014, whereas the magenta ones are obtained for the 2019 observations. The circles refer to those parameters calculated from the best-matching EMDs that have as flaring contribution the FLs from Class С to X time-averaged over their evolution (Sect. 3.2.4). The magenta triangles are instead calculated from the best-matching EMDs that include flares of Class С and M time-averaged over their evolution. (Sect. 3.2.5)
Current usage metrics show cumulative count of Article Views (full-text article views including HTML views, PDF and ePub downloads, according to the available data) and Abstracts Views on Vision4Press platform.
Data correspond to usage on the plateform after 2015. The current usage metrics is available 48-96 hours after online publication and is updated daily on week days.
Initial download of the metrics may take a while.