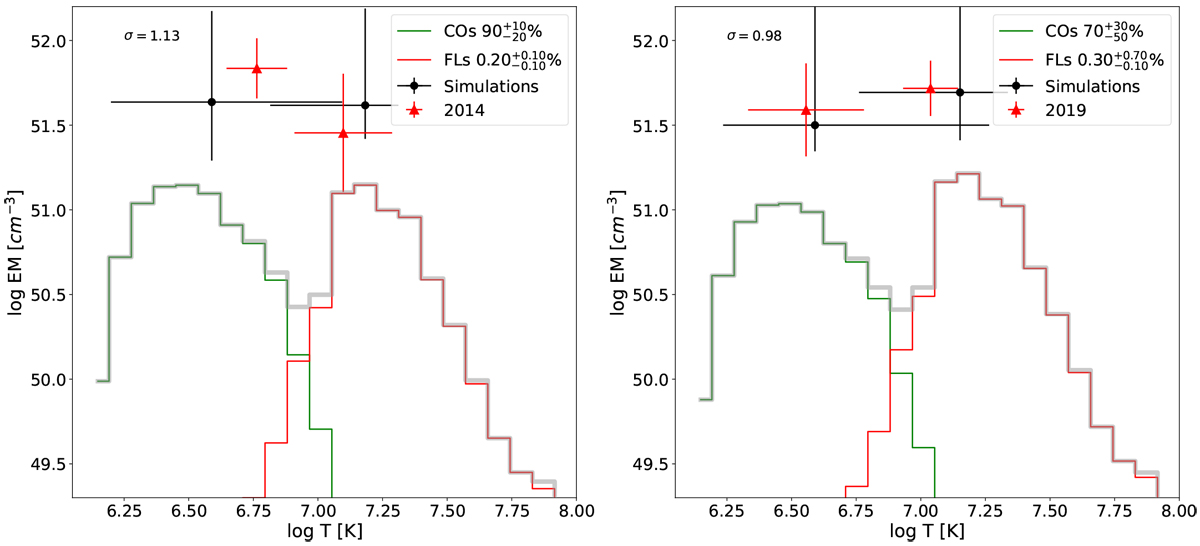
Fig. 5
Download original image
EMDs constructed from solar magnetic regions that best match the observations of Kepler-63 (on the left: 2014; on the right: 2019). The contributions to the total EMD (grey line) are from time-averaged COs (green line) and FLs (red line) from Class С to X time-averaged over their evolution. The confidence level σ within which the models are selected is given in the upper left corner of each plot. The EMDs are scaled to a larger size of the corona of Kepler-63, i.e. 30% larger than its stellar radius. The red squares are the best-fitting parameters of the X-ray spectra of Kepler-63. The black circles are the best-fitting parameters retrieved from the best-matching synthetic spectra. The filling factor for the best-matching combination of magnetic structures is given in the legend.
Current usage metrics show cumulative count of Article Views (full-text article views including HTML views, PDF and ePub downloads, according to the available data) and Abstracts Views on Vision4Press platform.
Data correspond to usage on the plateform after 2015. The current usage metrics is available 48-96 hours after online publication and is updated daily on week days.
Initial download of the metrics may take a while.