Fig. 3
Download original image
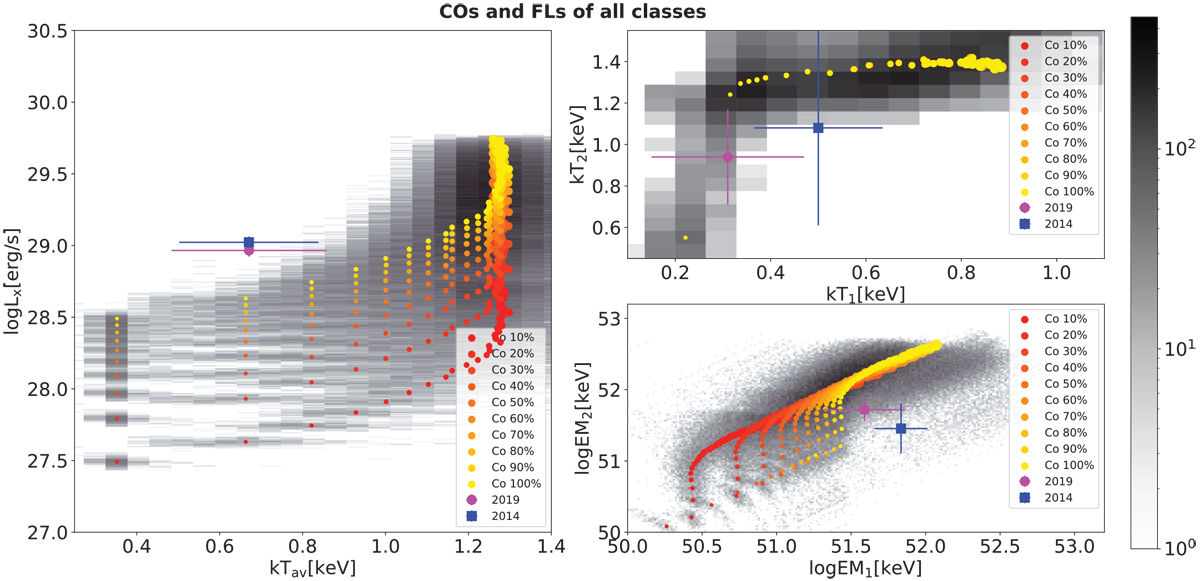
X-ray luminosity as a function of emission-measure-weighted thermal energy kTav (left panel) and the two temperatures and emission measures (right panel). The circles represent the synthetic spectra extracted from EMDs that are composed of time-averaged COs varying from a coverage of 10–100% of the total coronal surface (change of colour shade) and FLs – from Class C to X time-averaged over their evolution – that vary from 0 to 4% of the area of the COs (change of symbol size). The best-fitting parameters of the observations of Kepler-63 are overplotted with the blue square (2014) and the magenta circle (2019). In the background, the occurrences of each best-fitting parameter – that is, simulated 1000 times for each combination of magnetic structures by introducing Poisson noise – are shown with the corresponding colour bar in log scale.
Current usage metrics show cumulative count of Article Views (full-text article views including HTML views, PDF and ePub downloads, according to the available data) and Abstracts Views on Vision4Press platform.
Data correspond to usage on the plateform after 2015. The current usage metrics is available 48-96 hours after online publication and is updated daily on week days.
Initial download of the metrics may take a while.