Fig. 2
Download original image
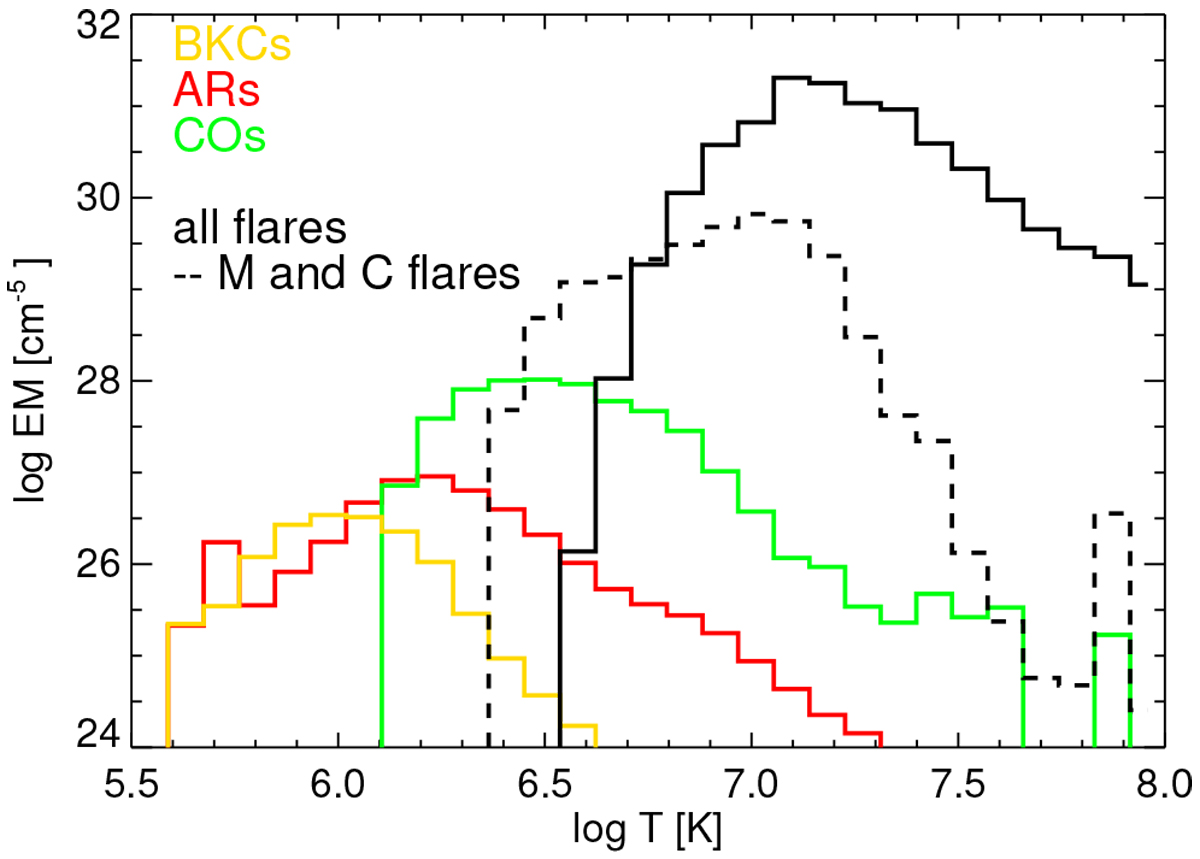
Average EMDs per unit surface area for each type of magnetic structure observed with Yohkoh. The black lines are the two flaring EMDs tested within this work: a time-averaged distribution derived from a sample of eight flares from Class C to X observed with a pair of hard filters with Yohkoh (solid black line; Sect. 3.2.4) and a time-averaged distribution derived from the flares of Class C and M in the sample (dotted black line; Sect. 3.2.5); M flares were also observed with a pair of soft filters.
Current usage metrics show cumulative count of Article Views (full-text article views including HTML views, PDF and ePub downloads, according to the available data) and Abstracts Views on Vision4Press platform.
Data correspond to usage on the plateform after 2015. The current usage metrics is available 48-96 hours after online publication and is updated daily on week days.
Initial download of the metrics may take a while.