Fig. 10
Download original image
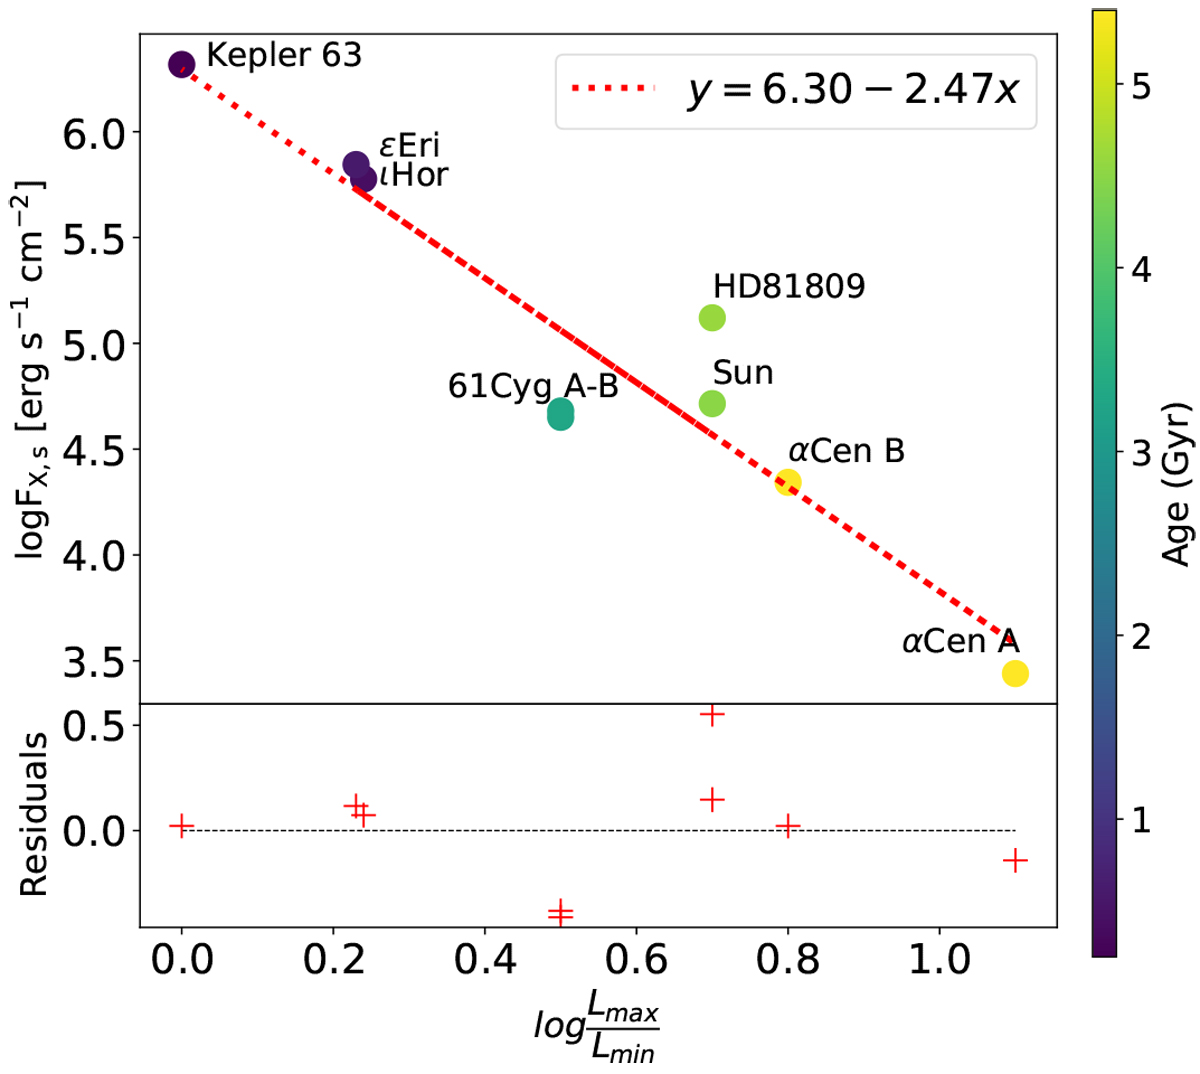
X-ray surface flux of all stars with known X-ray cycles as a function of the cycle amplitude, i.e. the variation of LX between the maximum and the minimum of the activity cycle. Kepler-63 is included in the plot, although we detect no X-ray cycle. The colour bar denotes the ages of the stars. The dotted red line is the linear regression performed on the data set. The result of the fit is given in the legend of the plot, while the residuals of the procedure are reported in the bottom panel.
Current usage metrics show cumulative count of Article Views (full-text article views including HTML views, PDF and ePub downloads, according to the available data) and Abstracts Views on Vision4Press platform.
Data correspond to usage on the plateform after 2015. The current usage metrics is available 48-96 hours after online publication and is updated daily on week days.
Initial download of the metrics may take a while.