Open Access
Fig. 1.
Download original image
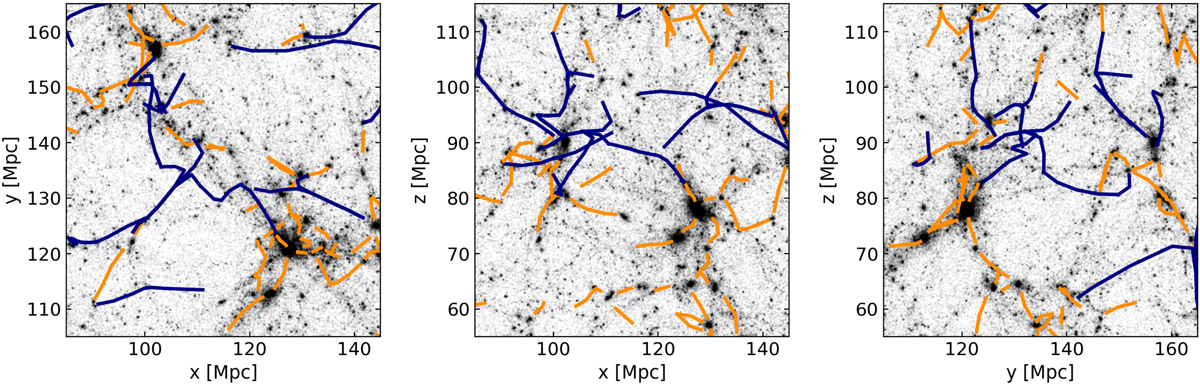
Box of 60 Mpc side length, projections onto the xy, xz, yz planes. Orange and blue lines represent the spines of short and long filaments, respectively. The black points show the underlying DM distribution. Short filaments are at the vicinity of nodes, whereas the long population traces less dense regions.
Current usage metrics show cumulative count of Article Views (full-text article views including HTML views, PDF and ePub downloads, according to the available data) and Abstracts Views on Vision4Press platform.
Data correspond to usage on the plateform after 2015. The current usage metrics is available 48-96 hours after online publication and is updated daily on week days.
Initial download of the metrics may take a while.