Fig. 9
Download original image
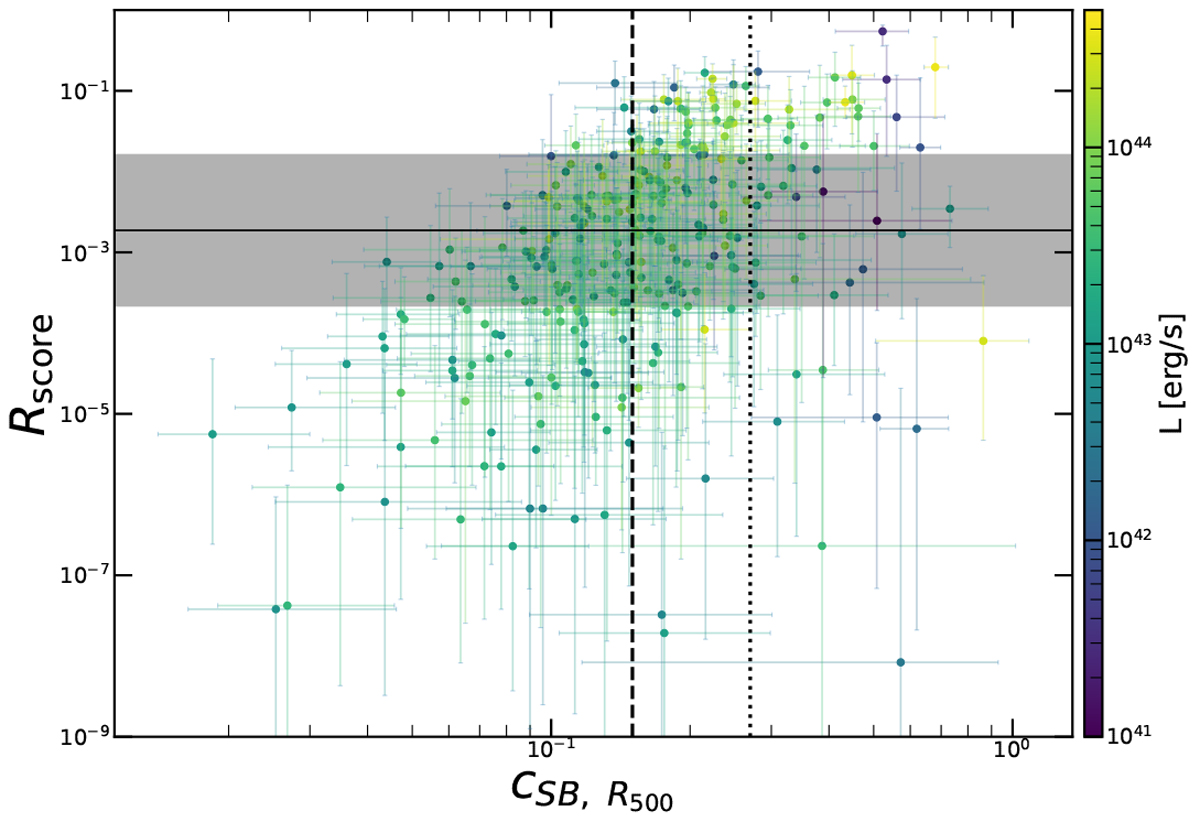
Distribution of the observed Rscore vs concentration. The horizontal line represents the best-fitting value for the log-normal distribution best fit. The dashed and dotted vertical lines indicate the thresholds at which relaxed clusters are distinguished from disturbed clusters as suggested by Lovisari et al. (2017). Cool-core clusters lie right of the dotted lines, and non-cool core clusters lie left of the dashed line.
Current usage metrics show cumulative count of Article Views (full-text article views including HTML views, PDF and ePub downloads, according to the available data) and Abstracts Views on Vision4Press platform.
Data correspond to usage on the plateform after 2015. The current usage metrics is available 48-96 hours after online publication and is updated daily on week days.
Initial download of the metrics may take a while.