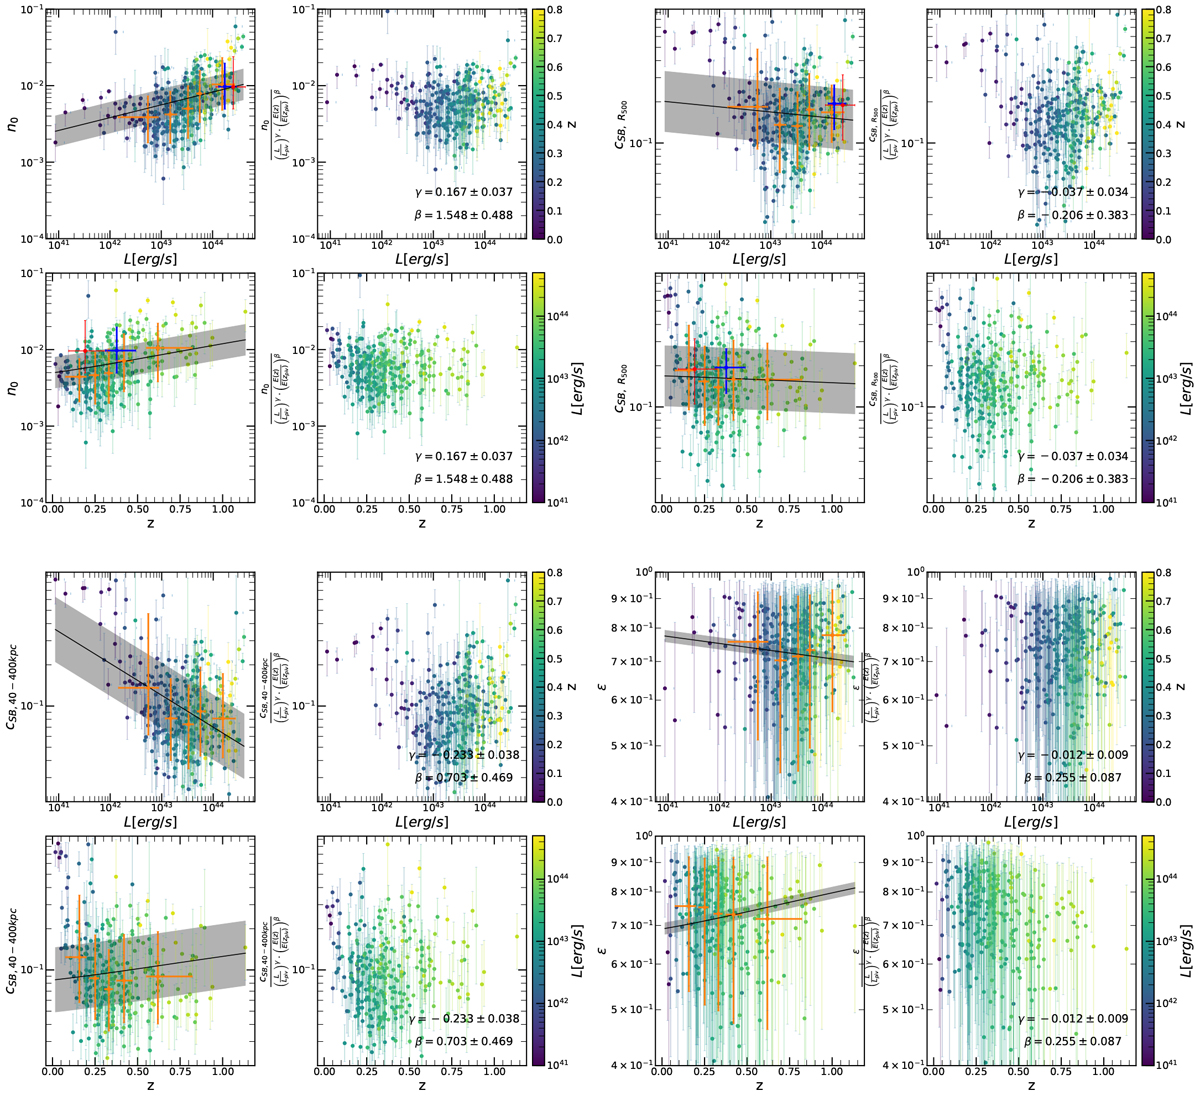
Fig. 6
Download original image
In all four main panels, top left subpanel: distribution of morphological parameters vs. luminosity, color-coded with redshift. The black line shows the best-fitting line (see Sect. 4.2). In the bottom left subpanel, we show the distribution of morphological parameters vs. redshift, color-coded with luminosity. The black line again shows the best-fitting line. The gray shaded area represent the scatter around the best-fit line. The red data point shows (when a direct comparison can be made) the result value obtained by Lovisari et al. (2017), which can be directly compared with the blue data point, which shows our results when we restricted the luminosity and redshift range to the same range as in Lovisari et al. (2017). The orange data point represents the average morphological parameter values obtained in luminosity or redshift quintiles. We show parameters corrected for redshift and luminosity evolution against luminosity (in the top right subpanel) and redshift (in the bottom right subpanel).
Current usage metrics show cumulative count of Article Views (full-text article views including HTML views, PDF and ePub downloads, according to the available data) and Abstracts Views on Vision4Press platform.
Data correspond to usage on the plateform after 2015. The current usage metrics is available 48-96 hours after online publication and is updated daily on week days.
Initial download of the metrics may take a while.