Fig. 6.
Download original image
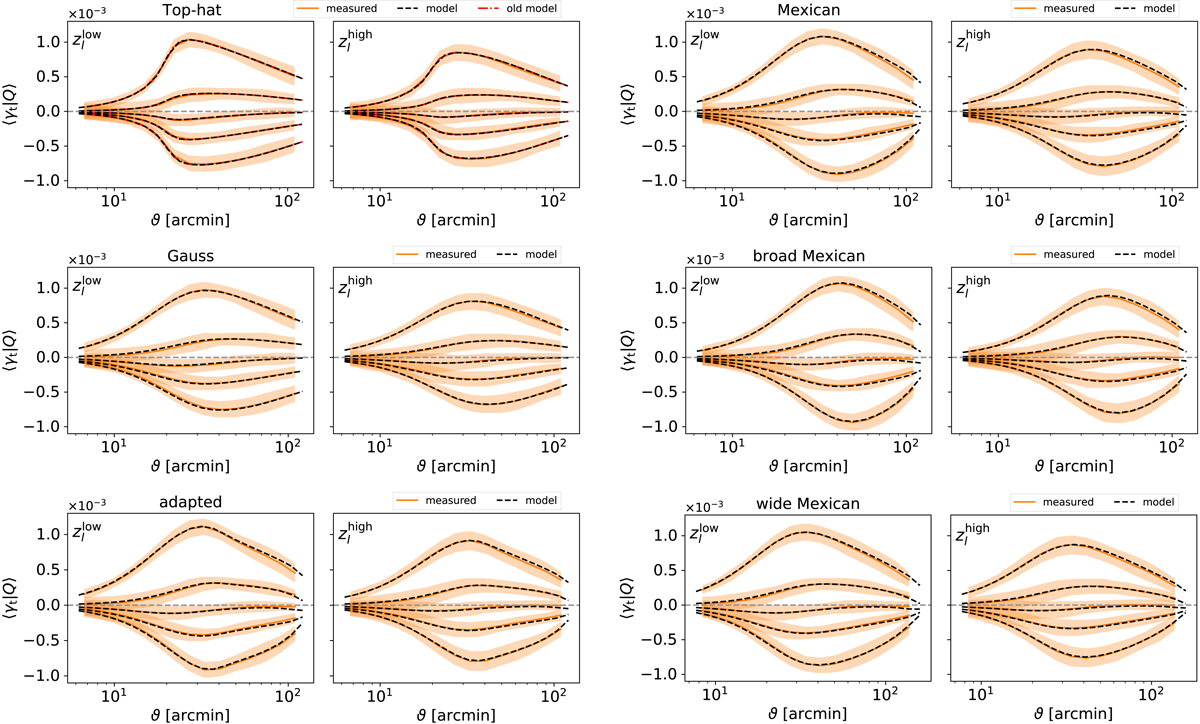
Predicted shear profiles for the two lens samples (dashed black line) and measured shear profiles (in orange) for the new model with filter U. The orange shaded region is the standard deviation on the mean from 48 sub-patches, scaled to the KiDS-1000 area. The residuals between model and simulations were tested to determine whether they can be erased when the PDF of the aperture number is fixed to the measured value from T17, but the same discrepancies were present.
Current usage metrics show cumulative count of Article Views (full-text article views including HTML views, PDF and ePub downloads, according to the available data) and Abstracts Views on Vision4Press platform.
Data correspond to usage on the plateform after 2015. The current usage metrics is available 48-96 hours after online publication and is updated daily on week days.
Initial download of the metrics may take a while.