Fig. 4.
Download original image
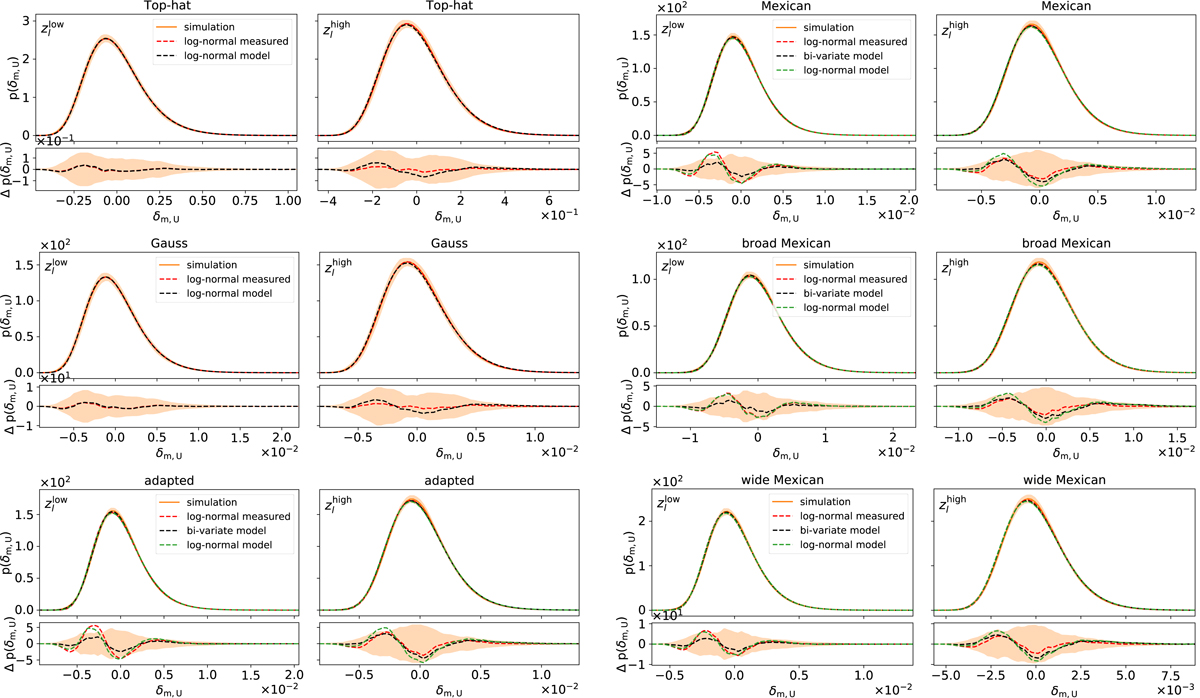
PDF of δm, U smoothed with the filters shown in Fig. 3. The orange shaded region is the standard deviation of 48 sub-patches scaled by a 777.4/859.4, where 777.4 deg2 is the effective survey area of KiDS-1000 (see Giblin et al. 2021) and 859.4 deg2 is the area of one sub-patch. The red dashed curve corresponds to a log-normal PDF with the measured moments ![]() and
and ![]() from the smoothed T17 density maps, and indicates the accuracy using a log-normal PDF. The green and the black dashed lines are both from the model; the green corresponds to the PDF of δm, U when using log-normal and the black using the bi-variate approach described in Eq. (26). Lower panels: residuals Δp(δm, U) of all lines with respect to the simulations.
from the smoothed T17 density maps, and indicates the accuracy using a log-normal PDF. The green and the black dashed lines are both from the model; the green corresponds to the PDF of δm, U when using log-normal and the black using the bi-variate approach described in Eq. (26). Lower panels: residuals Δp(δm, U) of all lines with respect to the simulations.
Current usage metrics show cumulative count of Article Views (full-text article views including HTML views, PDF and ePub downloads, according to the available data) and Abstracts Views on Vision4Press platform.
Data correspond to usage on the plateform after 2015. The current usage metrics is available 48-96 hours after online publication and is updated daily on week days.
Initial download of the metrics may take a while.