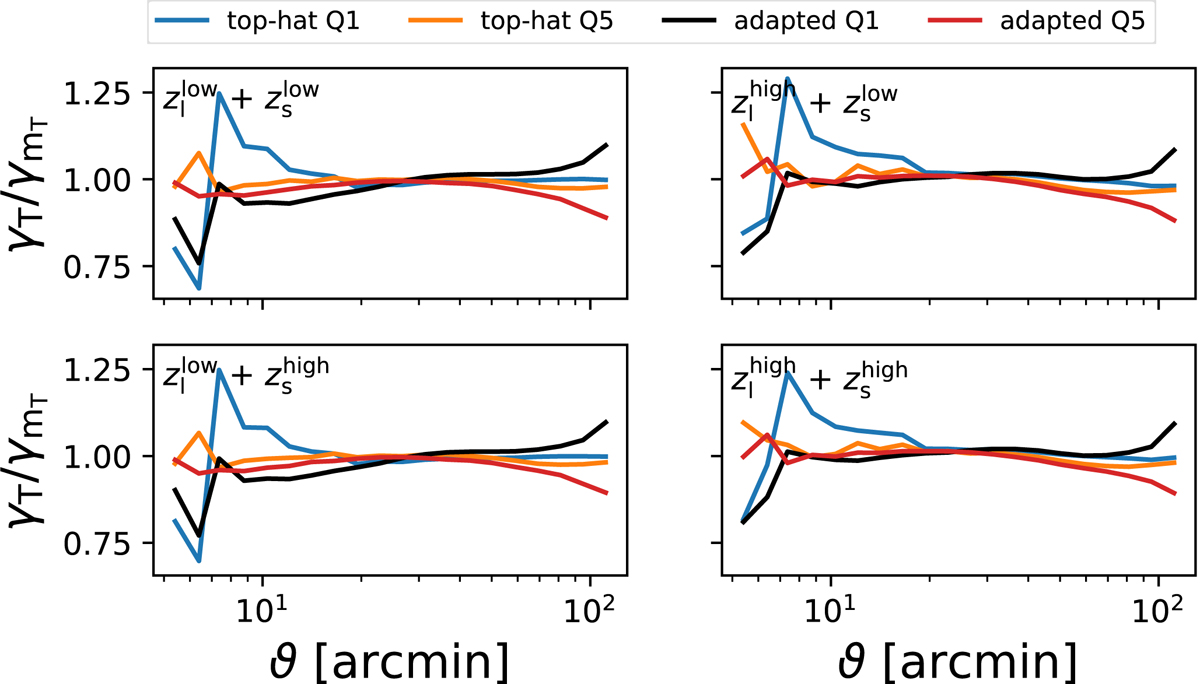
Fig. B.4.
Download original image
Calibration of the model γMT(pT) by the T17 simulations γT(pT) explained in Eq. (47), shown for the highest and lowest quantile for the adapted and top-hat filter. The corresponding redshift distributions of the lenses are given in Fig. 1 and for the sources several T17 shear grids are averaged, weighted by the n(z) given in Fig. 2.
Current usage metrics show cumulative count of Article Views (full-text article views including HTML views, PDF and ePub downloads, according to the available data) and Abstracts Views on Vision4Press platform.
Data correspond to usage on the plateform after 2015. The current usage metrics is available 48-96 hours after online publication and is updated daily on week days.
Initial download of the metrics may take a while.